This article explains how information that sits in a schematic drawing can be persisted as data, XML or other.
Why a picture is worth thousands of bytes
Humans use schematic diagrams to grasp technical systems. We master complexity by drawing models that show reality as simple as possible – but no simpler.
Drawings have carried information for thousands of years. Only very recently did we start using computers to pass around information. However, where a drawing conveys oodles of information to a human, a computer sees arrays of pixels or at best a set of shapes. Humans draw things as concepts and how they connect. A drawing truly is worth a thousand words, and many more bytes.
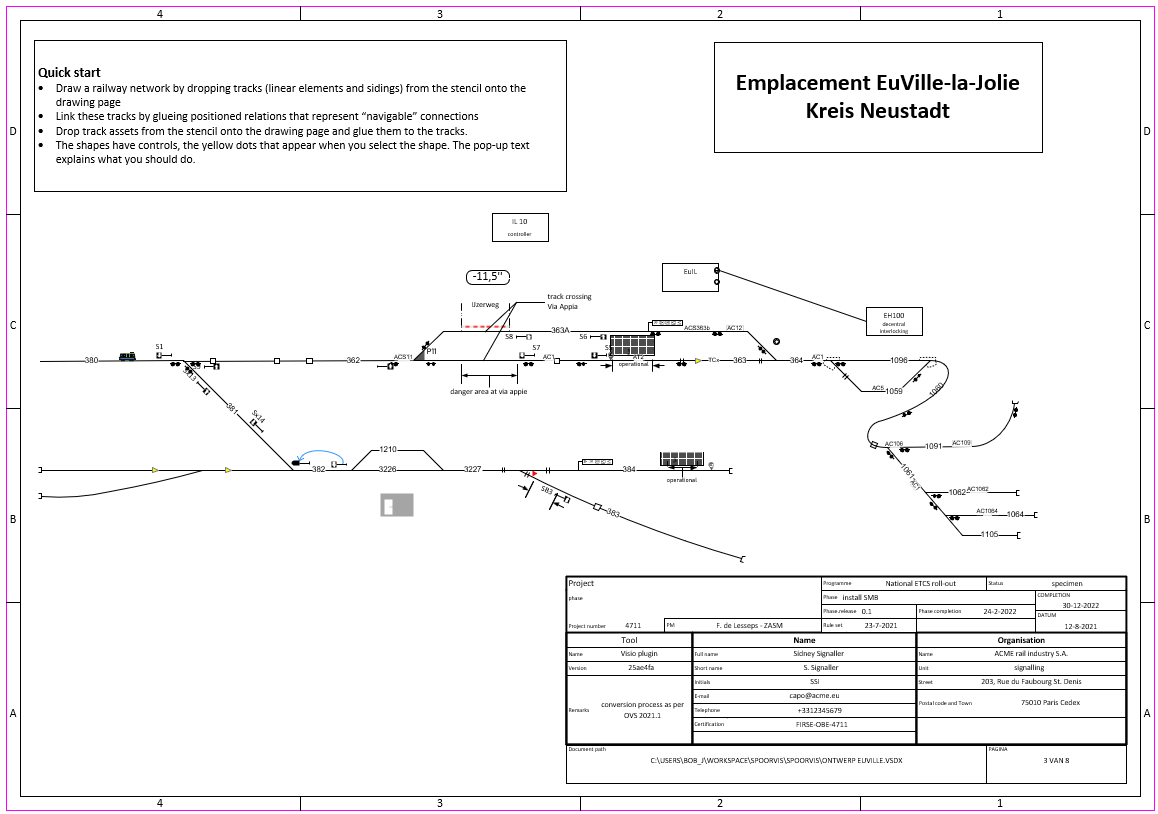
Below diagram shows a railway and signalling equipment. To the human observer with just a little training, the shapes represent concepts such as signals and in such a way that one knows that the signal applies to a track, in which direction of travel it applies and even which messages the signal can send to an approaching train.
A computer at best only sees linestrings or worse, an array of pixels in case the drawing is a scan.
Short, there’s a big gap between computer graphics and human interpretation of schematic drawings. This story explains how to bridge this gap.
What is a schematic drawing anyway?
A schematic drawing to a human is a collection of meaningful shapes and relations between shapes. People developed tools to graphically capture information in drawings and export the information for subsequent computer processing. This is the essence of Computer Assisted Design (CAD) and Building Information Modelling (BIM). We used to have sets of drawings, each representing different views, angles and interests of a system. These views typically come as overlays but it can be hard to avoid conflicts such as power supply cables that are missing because the signalling engineer wasn’t aware of the power grid, or cable ducts that cross sewers. Ideally, we have one single source of information to construct a building, a bridge, airplane, railway signalling system or any other system. This single source should be digital. And an overlay or representation of a concern such as power, cabling, route planning, construction planning, should be a view of the data.
The graphical representation is for humans, the digital representation is for computers.
Schematic drawing of the kit on a railway yard. A human, given a little training, sees oodles of information here.
What you see is what you get
Engineers have always designed systems by drawing. An architect draws a wall, doors, windows, piping, and the CAD program produces a bill of materials, a cost estimate, soil to be displaced and signals any problems that occur when a drain pipe sits in the way of an electric cable duct. Visuals and data are coherent: you get what you see and vice versa.
Under the bonnet of CAD programs, there’s some nifty trickery. The architect cum E-draughtsman typically starts with a blank page, e.g. A3 at a scale of 1:1000 and has a library of master shapes, i.e. stencils.
What kit do you want ?
When the architect drops a master shape, e.g. a signal on a page, the CAD program instantiates an object of type Signal in memory. The master shape has a set of properties such as identity, name, supplier, light aspects, etc., etc,. Specifying these properties is like filling in the blanks in an form; once complete, one can order the signal from a supplier who should have enough information to manufacture the thing, with the correct lamps and electronics.
Current practice is to separate drawings and lists of materials. The link between either type of document must be maintained because divergence can result in extra costs.
The shapes in a schematic drawing should contain sufficient information to produce a Bill of Materials. A BoM is just another perspective on the data and important input when preparing quotes. A quote should be competitive yet accurate. Overoptimistic quotes tend to fall on someone’s feet sooner or later.
So where do you want it ?
Then comes the dreaded question “where do you want me to build this thing ?’. In the old days, the contractor would pick the location of the signal from the drawing, e.g. “at km4,7, next to track 12A”. But because the signal shape has been dropped at the correct place on the drawing sheet, the CAD program also knows next to which track and at what mileage the signal should be erected. Information like map coordinates, and where to show the signal on a control display are of interest to other users and can be stored as properties alongside the object. The question “where is my kit” is simple but the answer is a frustrating “it depends”. A builder needs to locate a signal with respect to the railway network and the designer of the control system needs to know its position on a screen. Having accurate location information again contributes to keeping costs in check at every project stage, from quote down to on site test.
How to wire it up ?
A railway signal, just like any other component of a complex system, is controlled by another subsystem. Engineers draw specialised diagrams and tables that show which controller connects to what kit. Imagine a pyramid with a control & command system at the top, central and decentral interlockings in the middle, field object controllers near the bottom and signals, point drives, train sensors etc, at the very bottom. We distinguish logical and physical control relations. A logical control relation exists between a control system and a field object that can be controlled from that system. A physical relation exists when there’s a cable or wire between two devices.
The builder needs to know where to lay cables and how to connect devices to wires. The person configuring an interlocking needs to know which signals, points, etc. are controlled from the interlocking. When there’s a logical relation between a controller A and a field object B, there must be a physical carrier for the messages between A and B.
The story so far hit home that complex systems are highly linked. The avid reader-between-the-lines has noticed that the statements “a signal is located at spot next to the track” and “a signal is controlled from a control centre” insinuate that objects, both in the sense of hardware as well as software, have relations. In old-school engineering, this information sits in drawings (like pen-and-paper), spreadsheets and even text documents. Collating all this information from the various experts is error prone and corrections costs raise exponentially with each step in the process. Keeping system configuration data in lockstep is a daunting task – in particular when the data are stored in different formats and databases.
Your systems are linked – so why aren’t your data ?
CAD is hard
Domain experts such as signalling engineers aren’t skilled in CAD programs. This adds another layer of complexity because the design of a complex system involves experts from various domains and skilled draughtspeople tasked with reconciling the different design in a schematic drawing. Handling CAD programs requires training that goes beyond that of your average Microsoft Office user. Skills are in short supply. What’s more, licensing costs of CAD tooling and the assorted plug-ins are a serious threshold.
So why not use a Microsoft Visio to draw schematic diagrams ?
The essence of effective storage is this: designate a spot for every last thing you own.
Marie Kondo
Isn’t Microsoft Visio meant for business diagramming?
Visio really is a fairly advanced CAD-program. It does lack 3D functionality that comes with (far) more expensive CAD tools but under the bonnet does have great CAD functionality that allows serious design. If you’re willing to forgo the 3D features, and looking for a package that is commonly packed with Microsoft Office, this is worthy alternative.
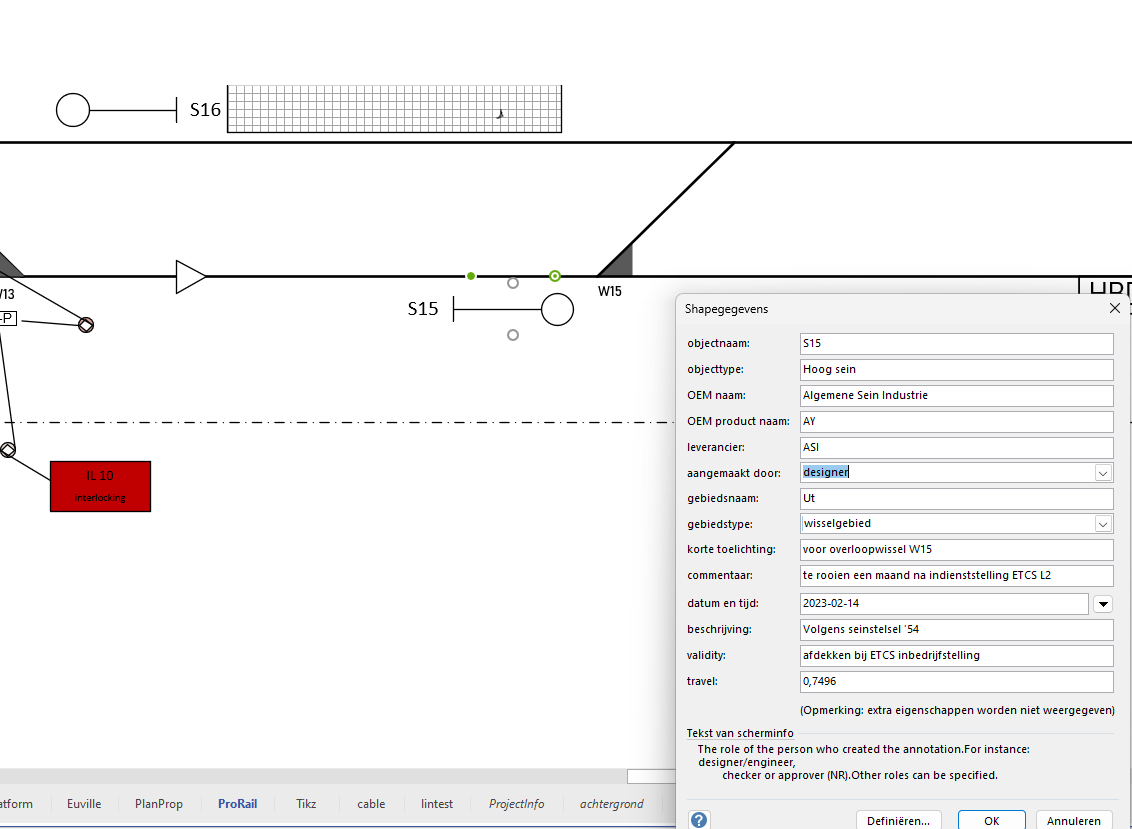
Below example shows an extract of a schematic drawing of a railway yard. Note that the signal S15 is “glued” to the right side of the track. The location of the signal along the track can be tweaked to match the actual “distance-along-track”, aka “travel”. It is common to pull shapes apart on the drawing because shapes tend to crowd in yards and in particular near points in true scale drawings. Many an effort has been made to automatically create schematic diagrams from GIS data because of the laudable idea that drawings should be generated from available GIS data. But one may wonder whether this effort is worthwile: automated decluttering and making the result visually appealing is hard. Apply a single manual correction and the hands-off paradigm breaks down.
The signal is located next to a track and works in direction left-to-right. The signal attributes come with the master shape and can be edited
Double-clicking opens a editor that allows informing a set of properties that ProRail covers ProRail requirements. This signal shape is an instance of a master shape taken from a stencil of ProRail shapes. In terms of Object Orientation a master shape compares to a class and a dropping such a shape on the drawing page equates to instantiating the class with the object properties.
Visio under the bonnet
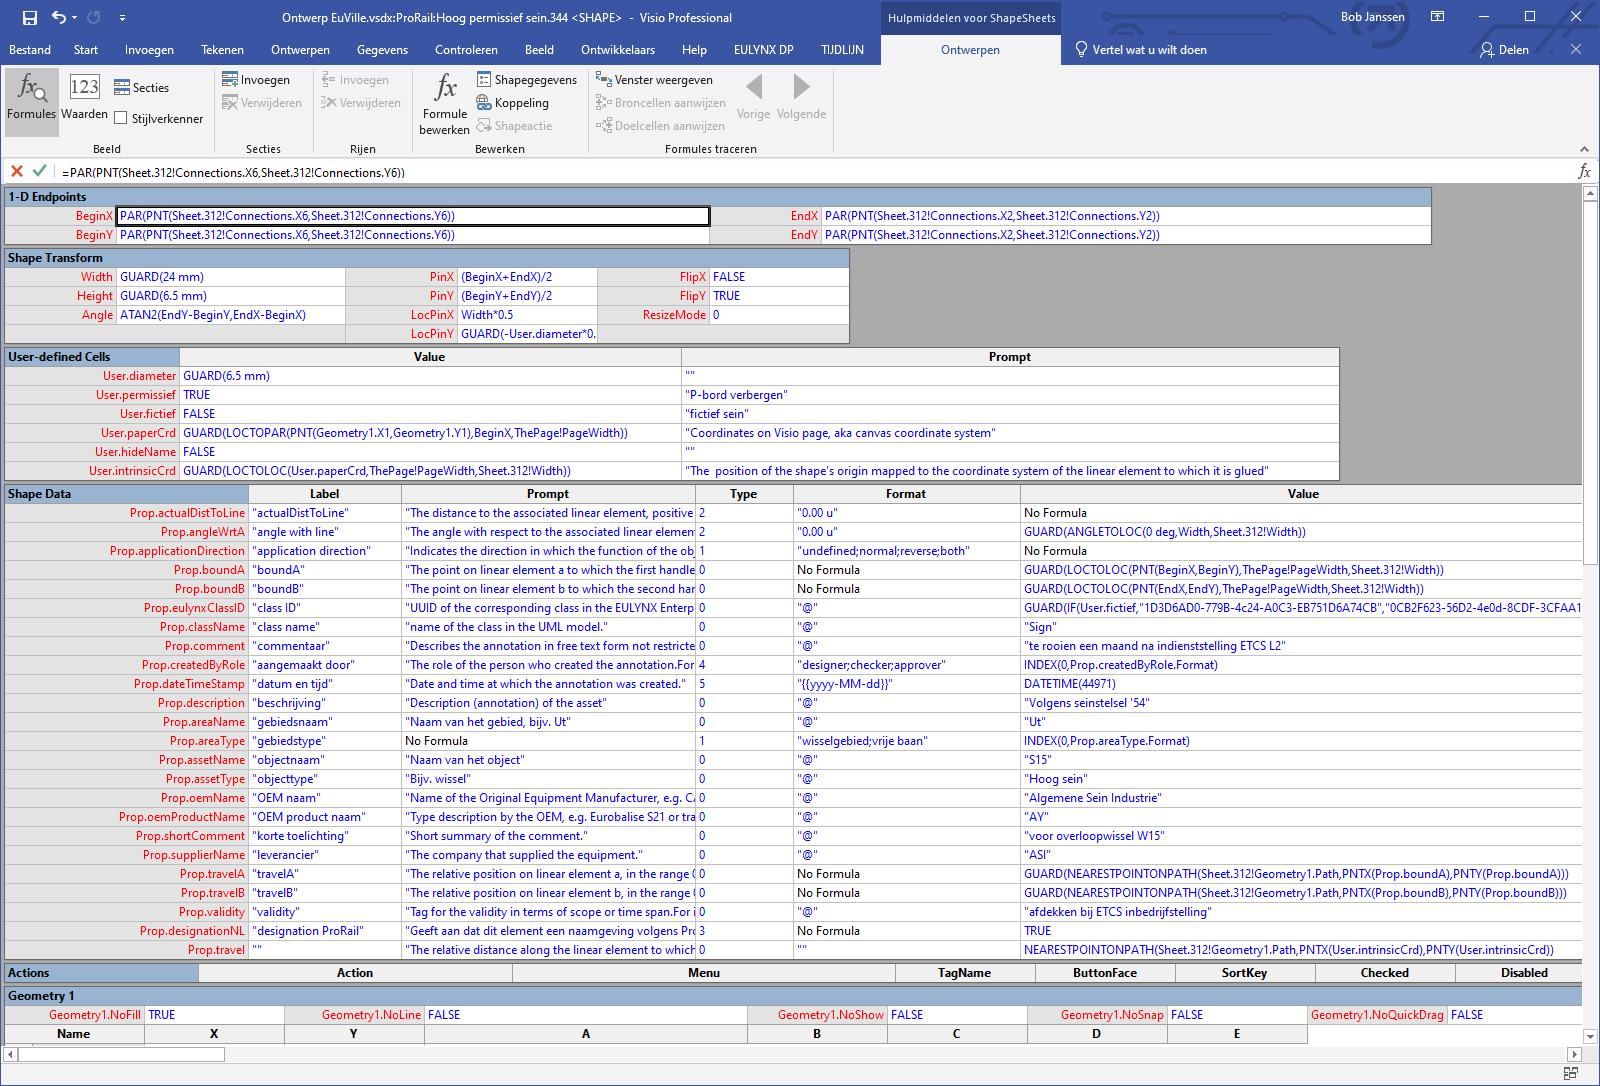
The shape, or object, has a number of parameters. Visio can display these in a tabular form, known as the Shapesheet. The properties are categorised, e.g. the geometry properties inform the shape’s outline so that the shape is correctly represented on screen and in print. The Shape Data can be considered functional object attributes that the user will want to tailor.
Typically, the user has a set of stencils that define master shapes, like classes, that come with attributes. The semantics and data type are found in the shapesheet. These guide the user when dropping master shapes on paper.
The shapesheet lists all properties of a shape, geometry, colour as well as data properties
The Visio Add-on
An add-on is a piece of software that latches on to a running instance of Visio (or any other Microsoft program for that matter). The add-on can read and modify the shapes’ Shapesheet. The software can leverage Visio trickery like change the geometry or detect other shapes in the vicinity. Below graphic shows how the add-on has been made aware of EULYNX DP shapes. The top drawing of a simple railway yard shows a triangular shape, representing an ETCS balise, that has a property eulynxClassID that refers to a class in the UML model. The curious reader may inspect the class here in the EULYNX DP model. The UML class model has been transformed into a C# library that is available as a Nuget. The add-on includes this library so it knows which class the shape represents, in this case an ETCS balise. The add-on also is aware of the object’s attributes by inspecting the C# class (“reflection” in .NET parlance).
The add-on can instantiate in memory an EtcsBalise object and its attributes by mapping the Shapesheet’s “shape data” to these attributes.
The little triangle drawn on the track (top) is an ETCS balise. The EtcsBalise class has an UUID that is “tattooed” into the shape’s data properties. This allows tracing the shape to an object that is an instance of the EtcsBalise class.
An object in memory
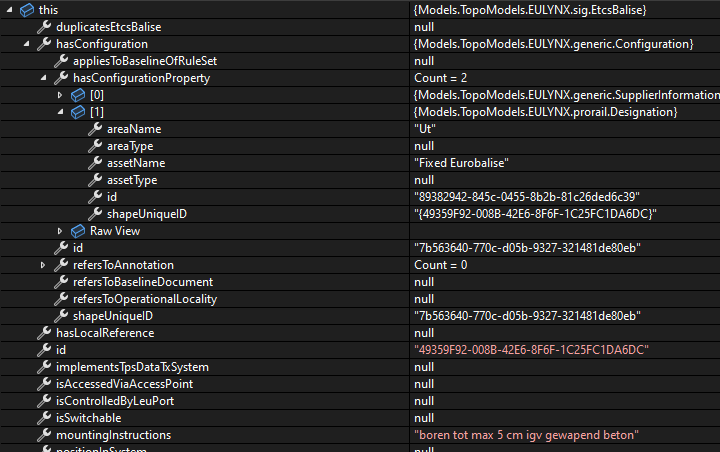
Below screenshot represents the information that the add-on stores in memory. The user adds information to a shape as if filling in a form. This information is then added to the object in memory. Note that the shape data such as the mounting instructions, have been copied to an attribute of the class. The simple triangle shape has now turned into a fully fledged ETCS balise object.
Inspecting the object data held in the computer’s memory
So we now have objects in the computer’s memory. It will be more useful when we can share these data with others.
Serialisation
Serialisation is the act of persisting objects that reside in computer memory to a file. A mental image of this process is to push the objects into a funnel and out comes a long sequence of bytes that are stored in a file, hence the name serialisation. A tried-and-trusted serialisation format is XML but there are many others such as JSON and Yaml.
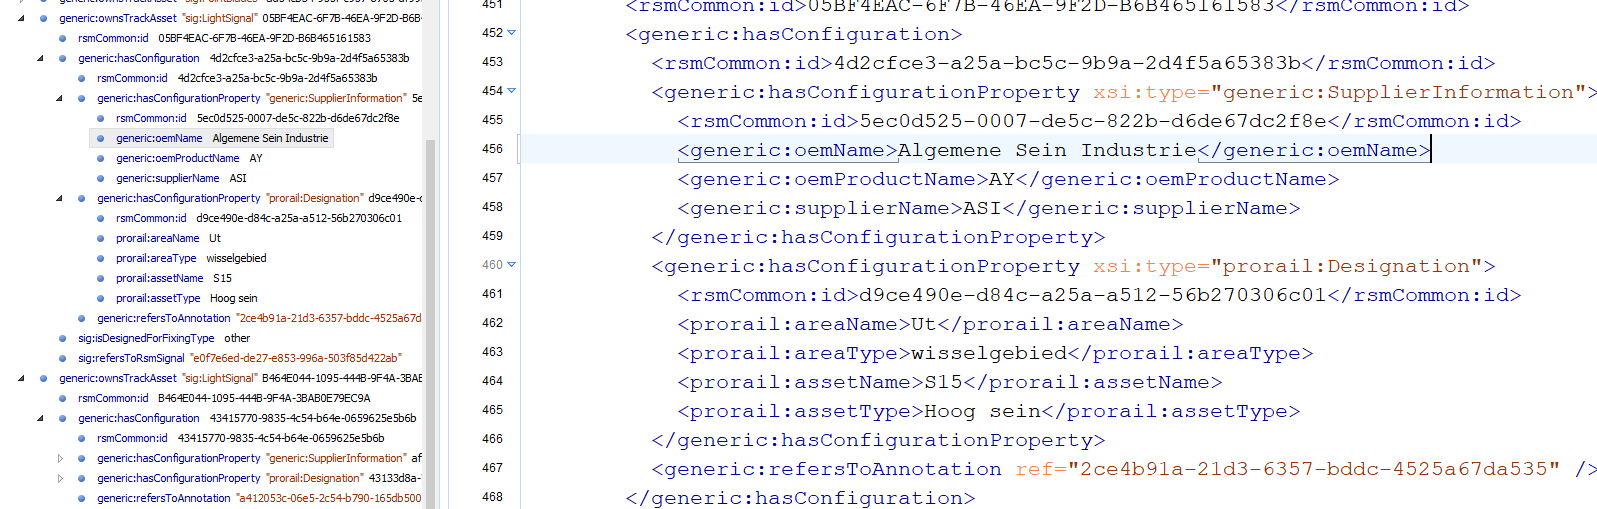
The C# class library that is packaged in the EULYNX DP Nuget contains serialisation instructions, class attributes in .NET parlance, that govern the serialisation. This greatly simplifies the task of converting objects that float somewhere in the add-on’s memory to a byte stream whence into an XML file. The upshot of this approach is that the produced XML validates against an XSD almost out of the box because both the .NET class library and XSD were produced automatically from the same UML source.
XML view of the data that describe signal S15
The XML data are normally zipped and packed with meta-data in a format, ready for delivery, that is described here
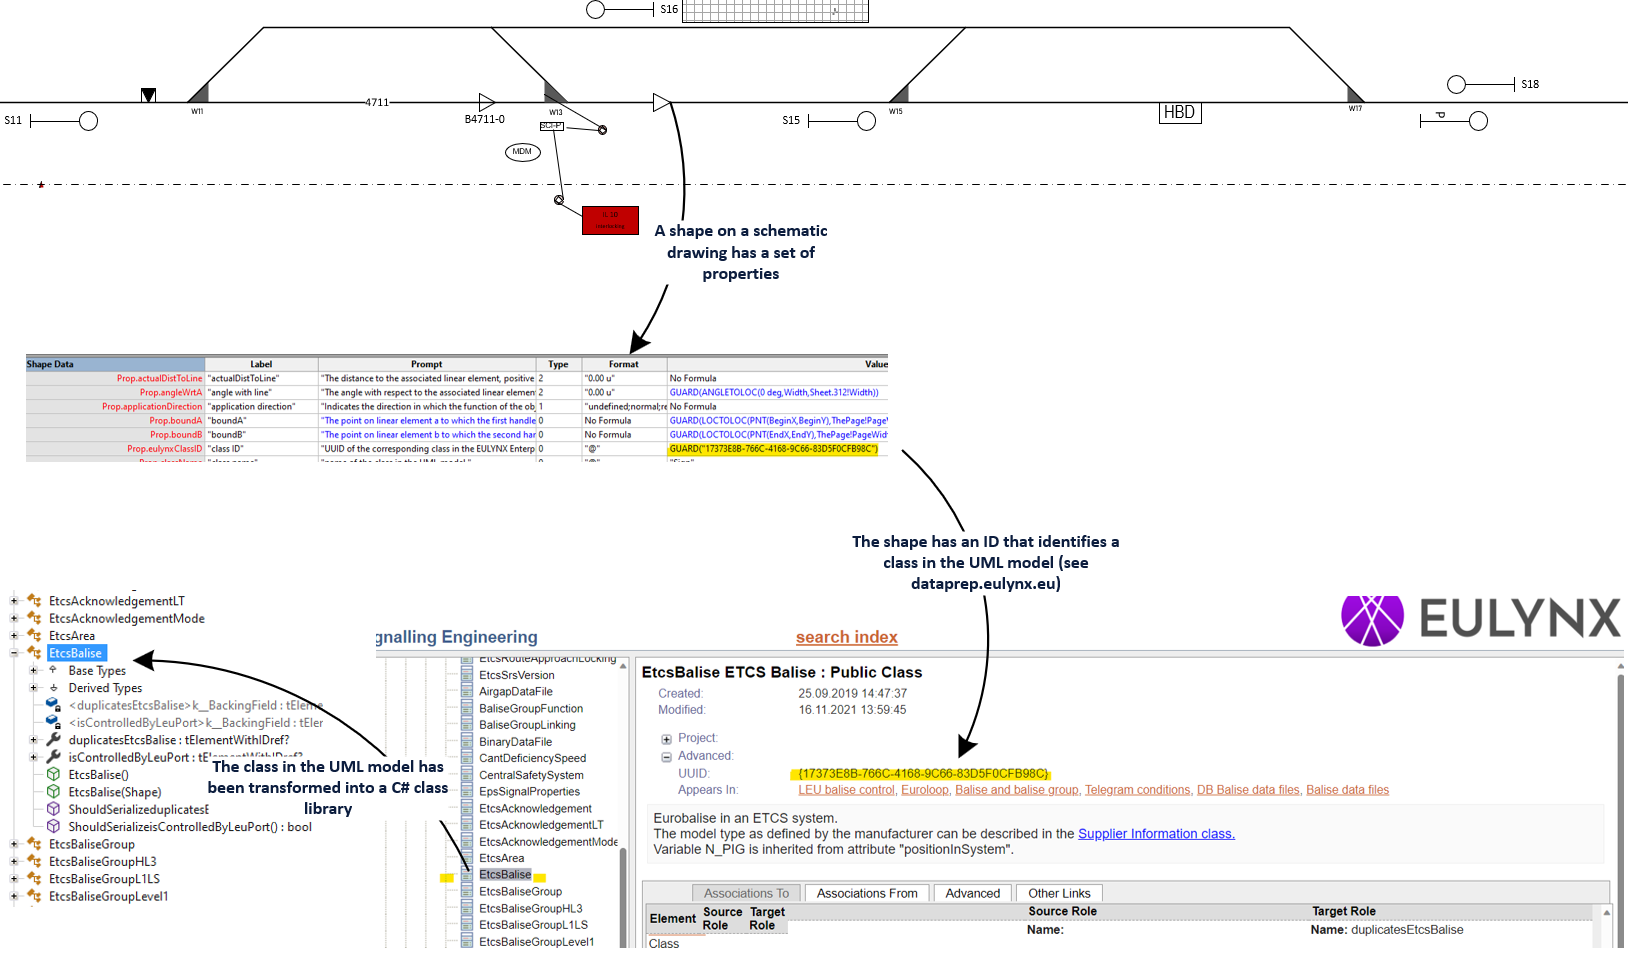 The little triangle drawn on the track (top) is an ETCS balise. The EtcsBalise class has an UUID that is “tattooed” into the shape’s data properties. This allows tracing the shape to an object that is an instance of the EtcsBalise class.