Making schematic drawings talk
Designers of networks, be it railway or telecoms, often face the question “how long is …” or “how far to…”. User stories abound, surely you can think of many more:
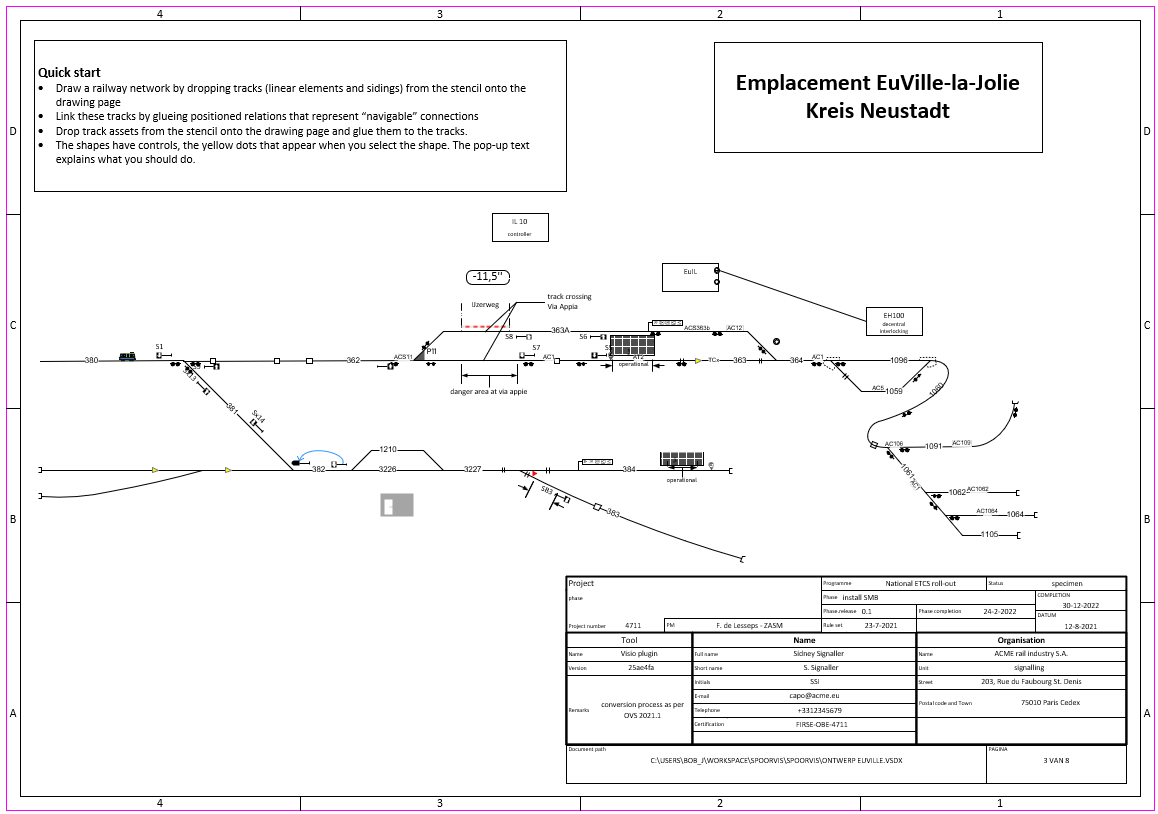
Getting the answer wrong has nasty consequences. Manual calculation, or even copy-pasting data into spreadsheets will have a high error rate. If the network topology and the length of curvi-linear shapes sits in the schematic drawing, why not let the drawing answer these questions.
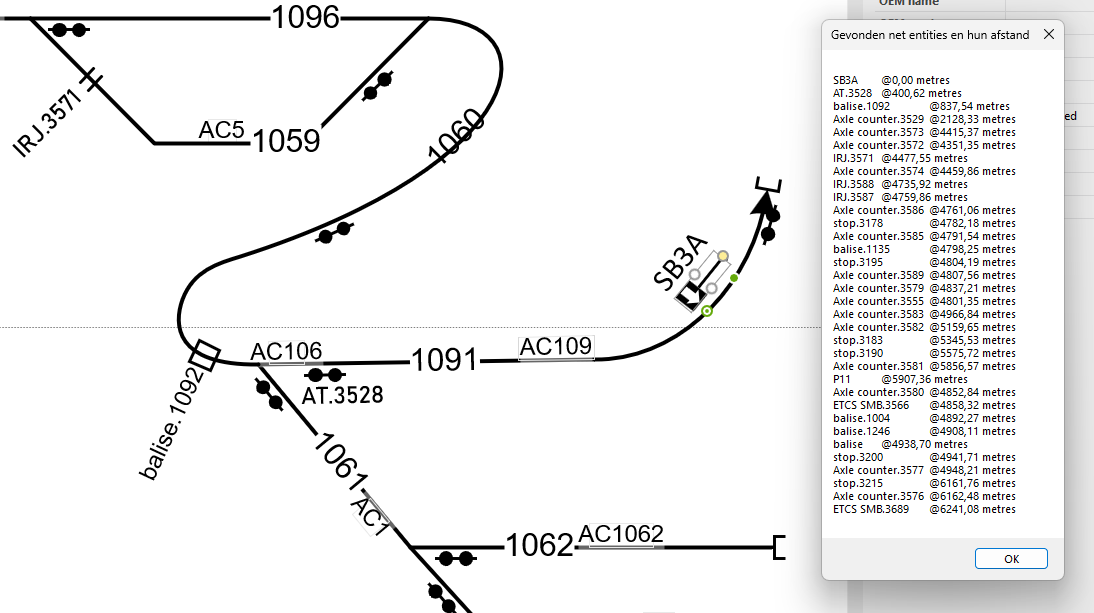
The network topology is known so the software can traverse the network like a train would (or electrons/fluids/gas/IP-packets/…). The RSM graph that underlies the network includes “navigability” information which states that one can travel between tracks 1091-1060, tracks 1061-1060 but not between tracks 1091-1061 (because trains don’t jump).
The tracks, or more general, the linear elements, have a nominal length property.
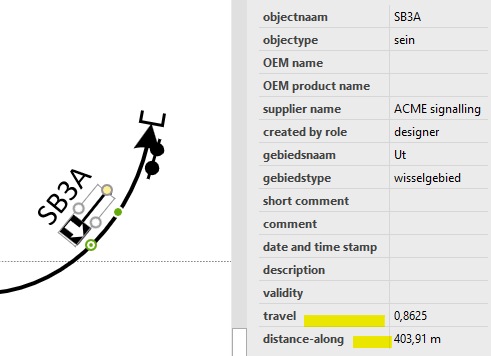
Finally, Visio “glued” the shape representing lineside kit to the tracks. A piece of equipment typically has a spot location that expresses where it is in terms of distance along a given track. Visio can compute this distance-along value, often called “travel” out of the box.
Summing it up, the distance from one piece of kit to the next is derived from network topology plus track length plus distance-along value.
GIS programs plot things where they are on the surface of the earth. But things tend to crowd in places where there’s a lot of kit, e.g. in busy stations. A geographic plot of lineside equipment becomes illegible as symbols and labels overlap. Schematic drawings aren’t geographic maps and typically aren’t to scale. The skilled draughtsman pulls apart shapes to make the drawing visually pleasing but this distorts the travel value. This begs the question how one can compute distances along paths in such cases.
The solution is as simple as elegant. Instead of letting Visio compute the travel value, one can set the value or import it from a foreign data source as shown here.