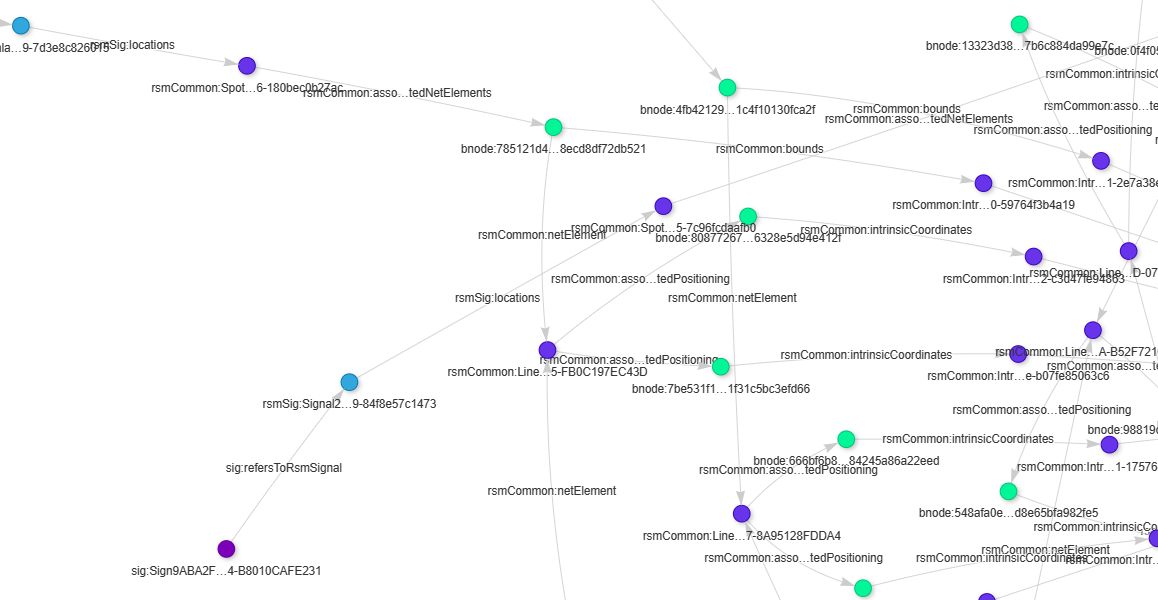
Schematic drawings can be considered front-ends to data. Each shape on the drawing carries information that can be captured as properties. Shapes have links to other shapes, e.g. a signal is located next to a track at a given distance along the track.
This article explores how Visio extracts the data from the schematic drawing. A Visio add-on produces structured data that are readily transformed into RDF (turtle format). This article, kindly hosted by Platform Linked Data Nederland, details how such data, can be explored and exploited.
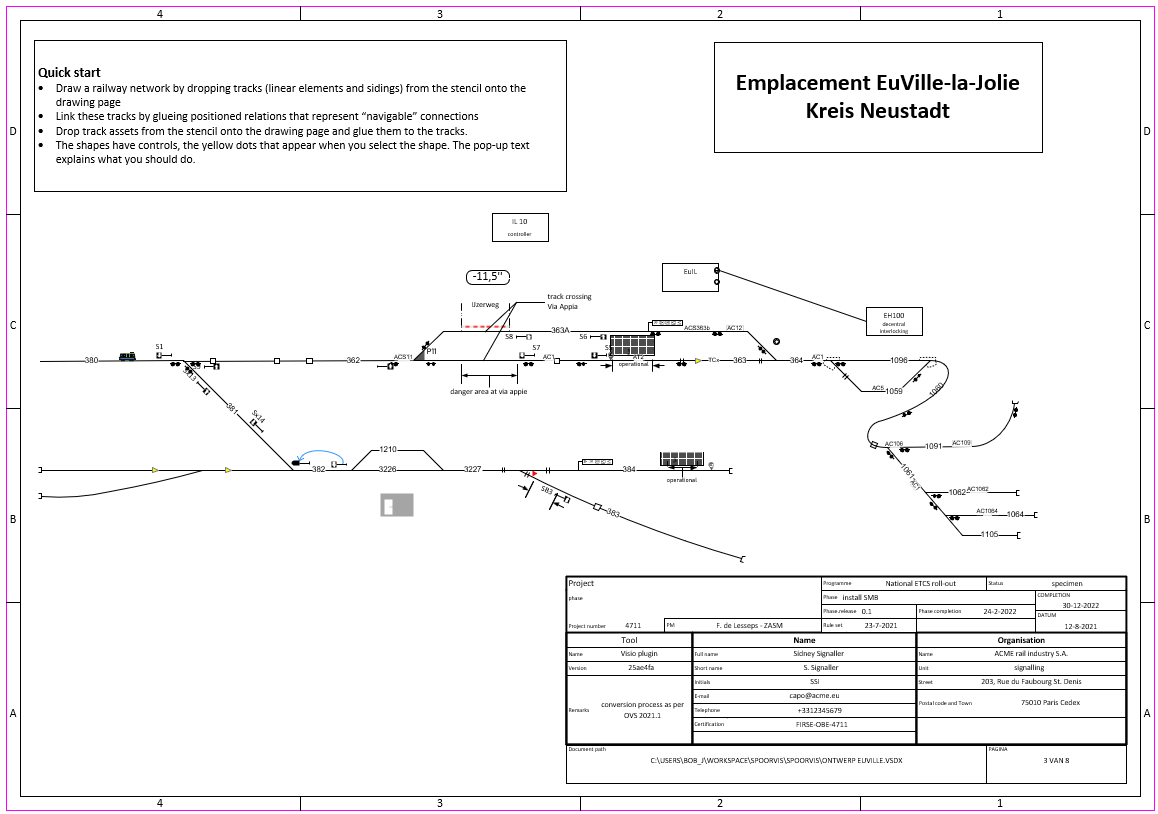
Schematic overview of a railway yard drawn and configured in Visio
a few linked objects extracted from the drawing
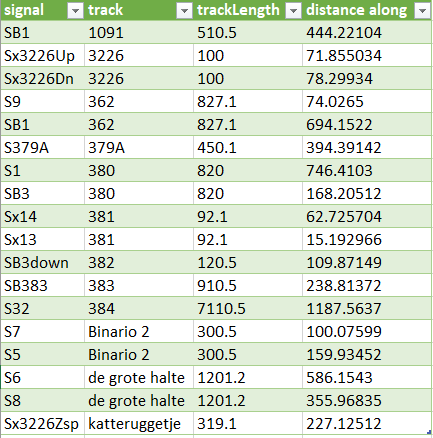
SPARQL queries can retrieve all sorts of interesting facts, such as the location of a signal along a track. Note that the table contains information that sits in the shape’s properties and aren’t necessarily visible in the drawing. A schematic drawing is for humans, the graph is what computers prefer, and an Excel table is for, well, old hands.
Leave a Reply