The World Wide Web was designed for sharing knowledge with both people and machines. This article explains how to use UML to capture and publish knowledge.
State of the art is to express knowledge in the language used by domain experts. This is subsequently turned into schemata for machines and, in a separate process, into text documents for people.
A typical business would define XSD and databases for machine processing on one hand and documents with text and figures that essentially describe the same things for people on the other hand. Obviously machine schemata and documents are likely to grow apart. This separation creates wasteful friction.
It’s actually easy to keep UML class models and documentation in lockstep.
But first, we identify three kinds of people we need to keep happy.
domain experts are good at jargon and like sketches but generally aren’t IT savvy (let alone friends of ontology)
Knowledge modellers are good at UML and maybe ontology but lack domain knowledge
IT experts can read UML class models but lack domain knowledge and generally steer clear of ontologies considered too academic.
The information trinity
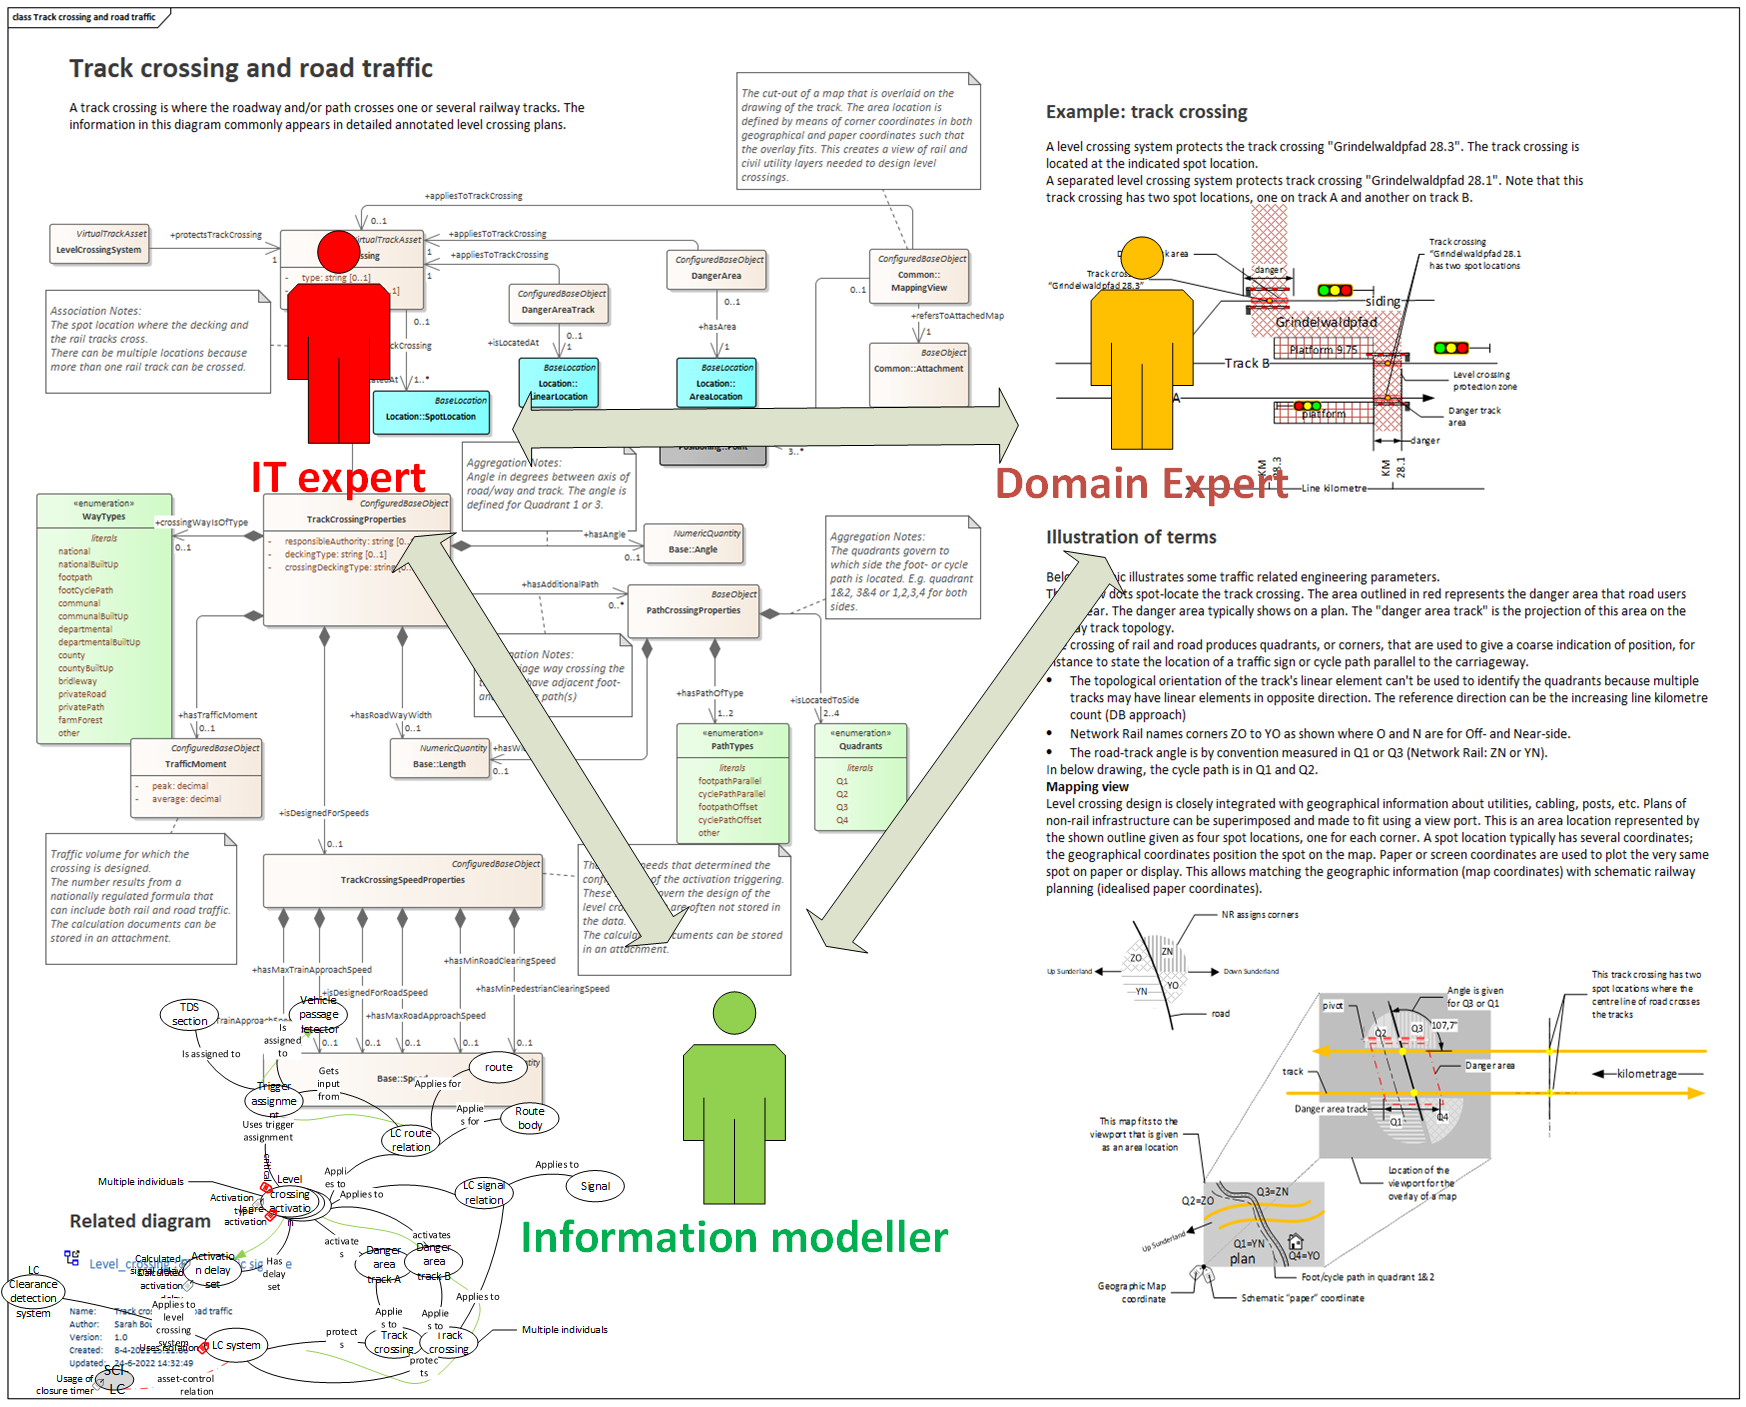
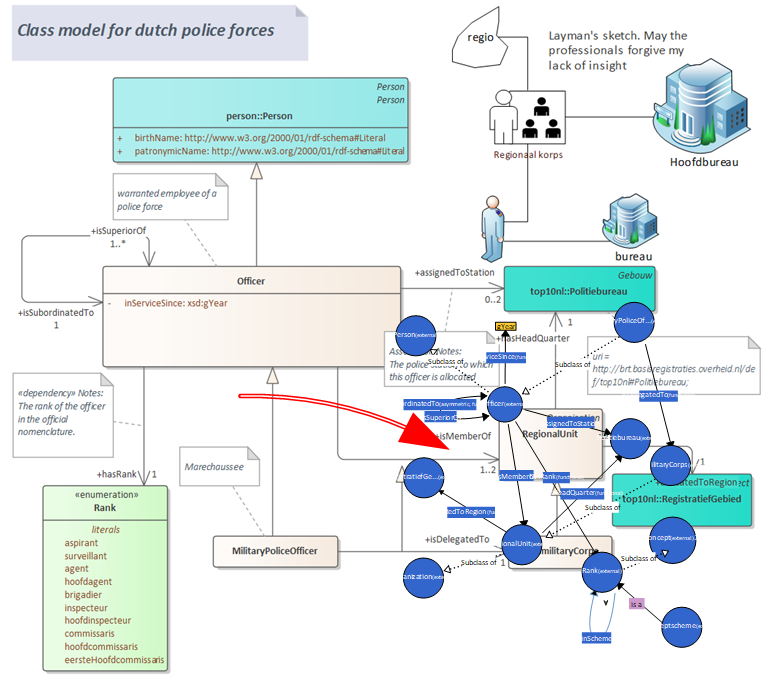
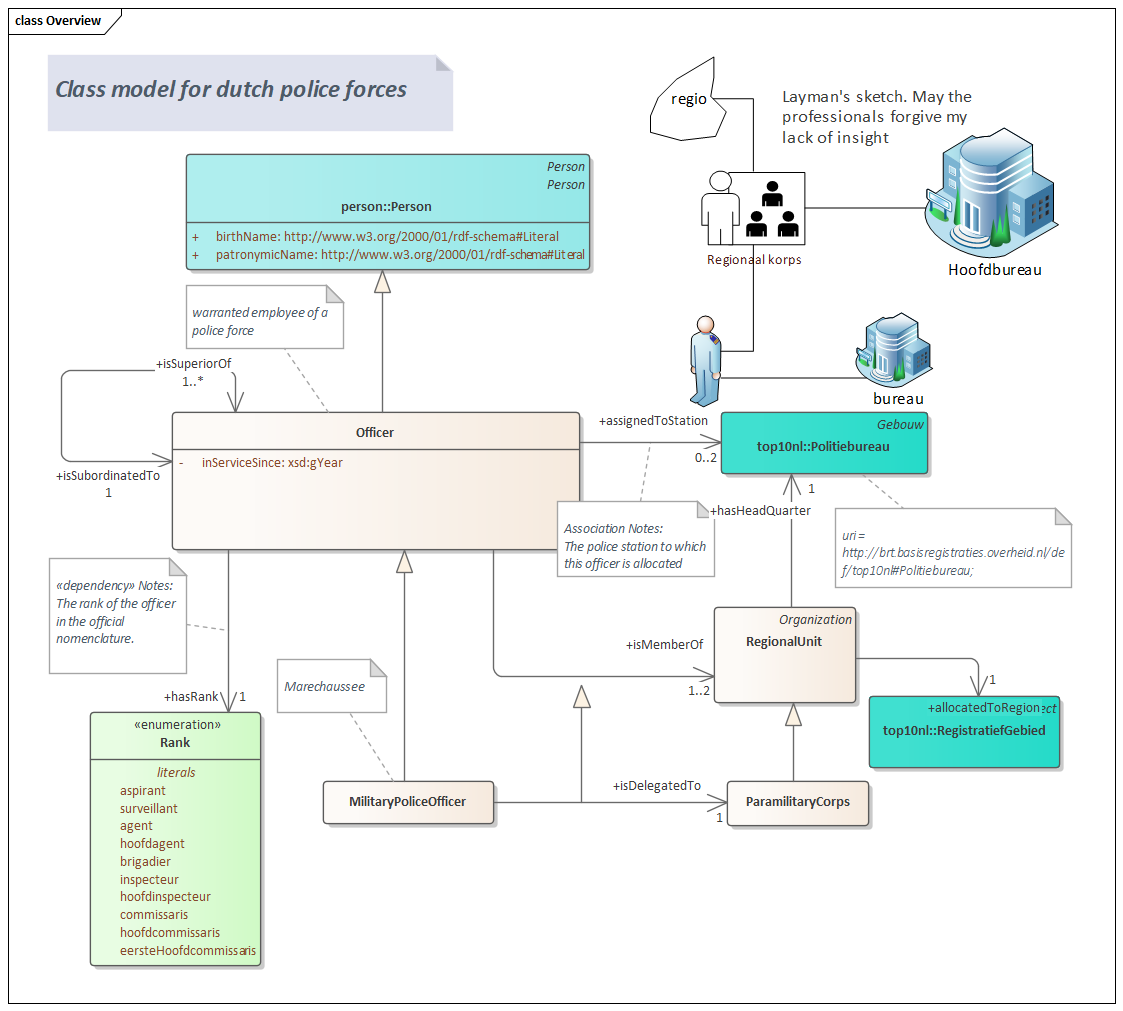
Below graphic shows the three experts and how their concerns can be united in a diagram.
The domain expert to the right will draw a sketch and “paint in words” what we’re looking at. In this case it’s about railway crossings. The information modeller at the bottom will cast the wording into a UML class model. The IT developer turns the UML into code.
There’s nothing special to this diagram except the presence of illustrations and explanatory text. Because the UML and illustrations are kept close to each other, the model is easily reviewed by all three kinds of experts. Grouping UML with text and figures is much simpler than maintaining UML separate from documents.
Single Source of Truth
Keeping the UML in a diagram with sketches and text creates a single source of truth. No need to maintain separate UML and documentation. And if needed, the documentation can be a print out of the diagram with possibly a listing created by the EA tool.
Another article explains how an AddOn to Enterprise Architect can produce RDF triples that match the model. The next step is to publish these triples to the web. Our aim is to create a website that acts as a landing page for URI’s. A user clicking on a URI should be lead to the webpage that provides context about the concept identified by the URI.
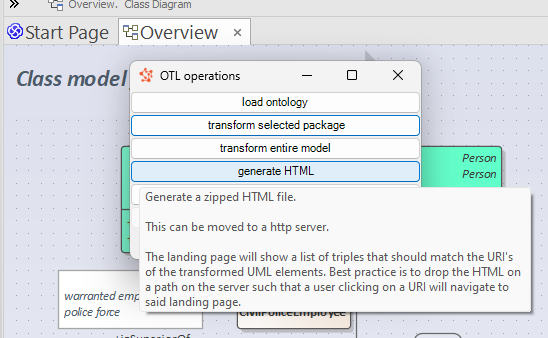
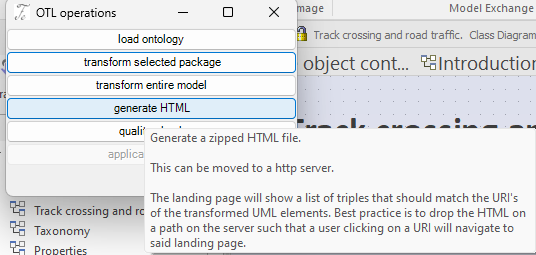
The EA AddOn enhances EA’s built-in HTML-publishing function by adding a landing page listing the triples.
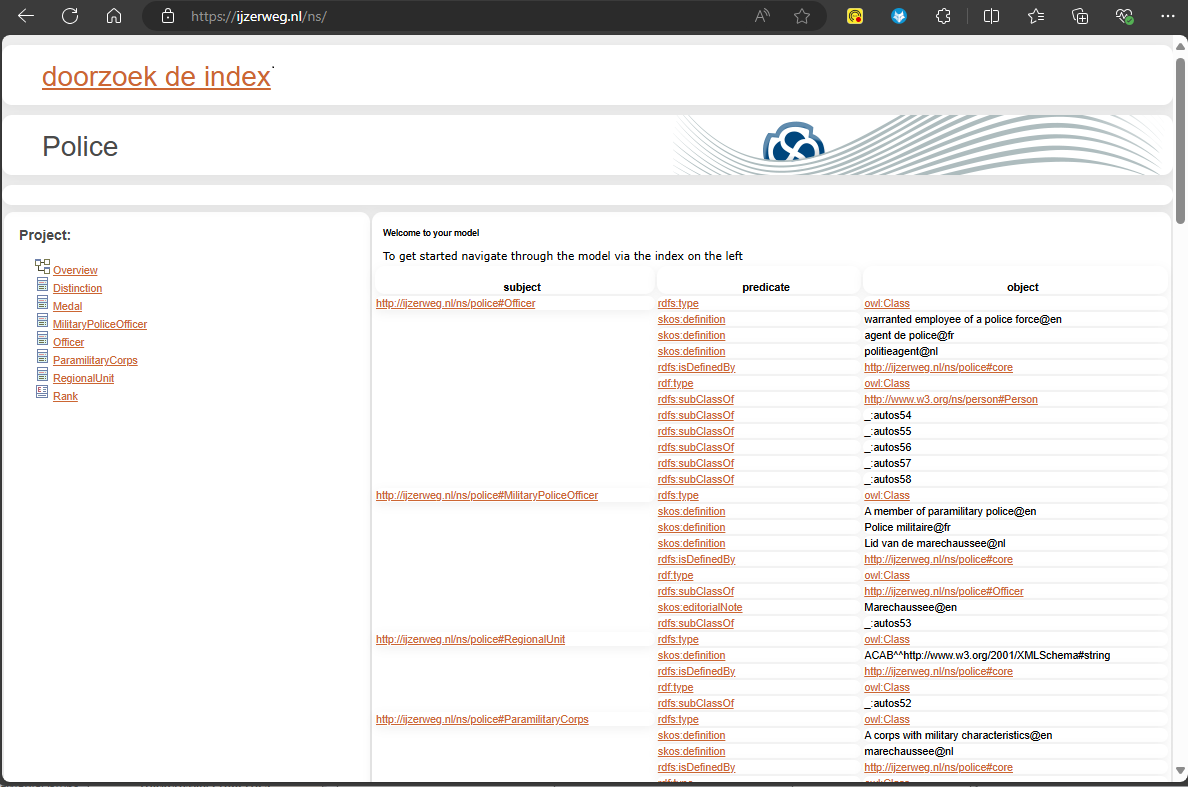
Below screenshot shows the landing page with a list of triples.
The user can publish the generated HTML to his website such that the URI’s actually have a home. An URL such as http://ijzerweg.nl/ns/police#MilitaryPoliceOfficer will lead to the shown landing page.
So by clicking a hyperlink, the user gets the context that’s originally defined in the model.
This is substantially richer than plain triples or plain HTML. More important, the UML seamlessly fits the HTML.
The user, whether domain expert, IT developer or modeller, doesn’t waste time switching between tools.
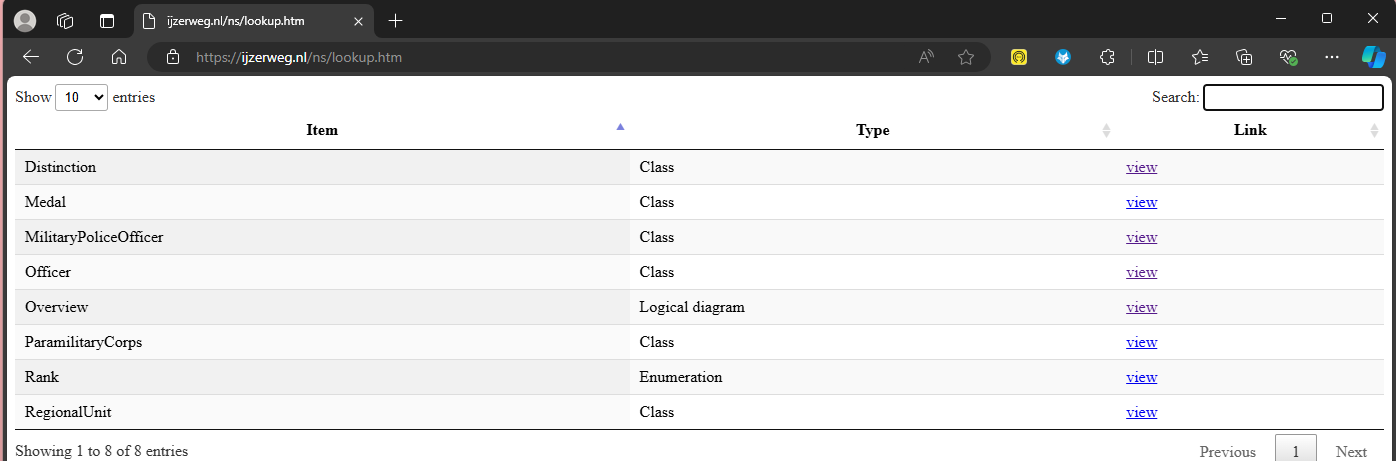
Search the model
The “doorzoek de index” takes the user to a searchable index that lists the UML elements defined in the model. Start typing in the Search box and a number of suggestions appear. The user can browse and look around the model.
The search capability is another important enhancement with respect to the standard EA HTML publication.
Interested in this Add-On for Enterprise Architect ? Feel free to contact bob at ijzerweg dot nl
TheEU’s JOINUP initiative, more specific the SEMIC workgroup, published a set of rules for turning UML into RDF. These rules boost knowledge engineering because they bridge the gap between UML conceptual models and concepts expressed as triples. This article highlights an AddOn for Enterprise Architect that lets users easily reuse existing ontologies in UML and publish ontologies as RDF.
I’m an ontologist – why bother with UML ?
The Unified Modelling Language is the most widely used to visually capture concepts in all kinds of business. RDF and OWL remain semantically richer than UML class models but UML still rules the roost.
There’s a divide between IT engineers and ontologists. IT engineers and domain experts enjoyed different training and education. The SEMIC ruleset applies for a small subset of UML class modelling and suffices to cover much knowledge engineering.
IJzerweg developed an AddOn for Sparx Enterprise Architect that honours the FAIR principles and bridges the divide between IT engineers, ontologists and domain experts.
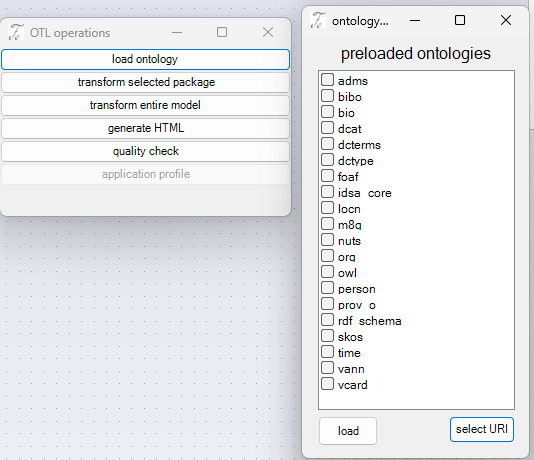
Loading ontologies is easy. A set of well-known ones such as foaf and dct are preloaded. Many others can be retrieved from the web by clicking selecting a URI that points to an RDF file.
The AddOn then inserts classes that match the concepts defined in the ontologies. The classes are stored in packages that match a namespace. The packages are named after the prefix, e.g. adms, bibo, etc.
The tool can load one or more ontologies, either in one step or in several stages.
Accessing concepts is best done by finding the URI that points to an RDF file, e.g. turtle. The AddOn retrieves the triples and turns them into classes, attributes and properties. The semantics are copied into the notes and the URI’s are stored in a tagged value.
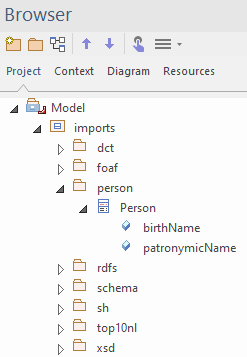
Below example shows the folder structure that appears after importing the Person ontology from http://www.w3.org/ns/person. This defines the concept Person with attributes birthName and patronymicName.
The tool is clever and creates empty classes that are defined externally. For instance, the concept person refers to a location to indicate place of birth and death. The concept “Location” is defined in Dublin Core Types and inserted as an empty class in the dct folder when the Person ontology is imported.
The user may wish to explicitly import the Dublin Core Type ontology at a later stage. The AddOn detects the presence of the dct folder with the Location class and enriches the Location class with extra information such as a semantic note.
Thus, a user can expand and explore the known universe by importing ontologies sequentially or in parallel without the fear of clobbering anything.
Imported triples link to triples defined in other ontologies. And by this virtue share the same properties and semantics. Data values declare units, e.q. S.I. or imperial so reducing the probability of mishaps in data conversions. Short, we know what we’re talking about, what features we’re observing and how features, are measured, e.g. in metres or candela per square foot.
Below screenshot shows that the Person’s birthName and patronymic name are an rdfs:Literal. Anyone else who uses this definition of a Person is aware of this.
The Officer, defined locally, has an optional attribute “in service since” which is defined as xsd:gYear. The officer has exactly one buddy. The hierarchy relations are expressed by the bidirectional association “is superior of” and “is subordinated to”. The namespace of the Officer concept is defined in a tagged value defined in the package that contains the Officer class.
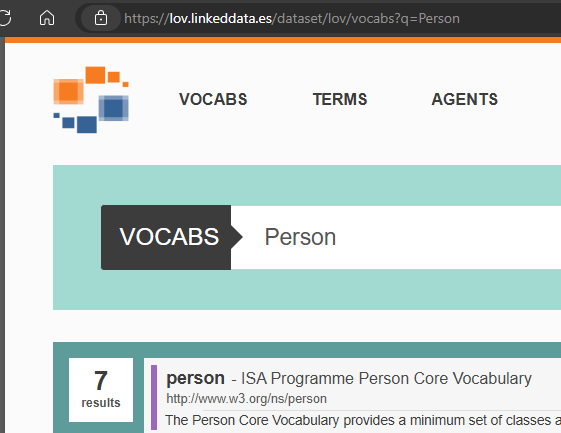
Publically available ontologies deserve better exposure and reuse. Simply import the ontology into EA and explore hidden gems. Try explore the LOV website for a concept in your domain and download the ontology that defines it. The tool automagically adds folders to the EA browser. Next explore what’s inside by dropping the classes into a diagram. Inspect the attributes, relations and read the imported notes at your leisure. More likely than not, someone else has already defined what you’re looking for.
Why reinvent the wheel if you can climb on the shoulders of giants.
Share stuff
At some stage you’ll want to share RDF. Right click and select “transform selected package”.
Add trust
The transformation process produces a log that shows progress. The log is stored in a file. It’s good practice to inspect the log for warnings and error messages. For instance, the AddOn needs information how to build a URI for each concept. If this is missing, the tool reports an error.
check the log
The log classifies messages as information, warning or error. The AddOn provides context in an attempt to explain and hint for remedies. In below example, the AddOn failed to construct an URI for a connector that links two elements in two namespaces. The tool can’t decide for itself whether the property lives in the referring or referred namespace so it reports an error.
The AddOn is multilingual. Below version speaks Dutch to match my Windows machine.
22-6-2024 15:59:00 Information - Class Officer getransformeerd
22-6-2024 15:59:00 Information - Class MilitaryPoliceOfficer getransformeerd
22-6-2024 15:59:00 Information - Tagged value skos:definition vervangt een bestaand triple http://ijzerweg.nl/ns/police#RegionalUnit , http://www.w3.org/2004/02/skos/core#definition , A formal organisation for keeping societal order in a given region@en
22-6-2024 15:59:00 Error - Er is geen URI vastgesteld voor runsPoliceStation
22-6-2024 15:59:00 Hint - Dit gebeurt meestal als de connector twee klassen uit verschillende namespaces koppelt.
Een associatie wordt op een object property afgebeeld welke een URI toegewezen krijgt,
22-6-2024 15:59:00 Hint - Dus wanneer een connector twee namespaces koppelt, is de namespace van de object property niet eenduidig.
Overweeg om een base-uri tagged waarde toe te wijzen aan het doel van de connector
22-6-2024 15:59:00 Information - Class RegionalUnit getransformeerd
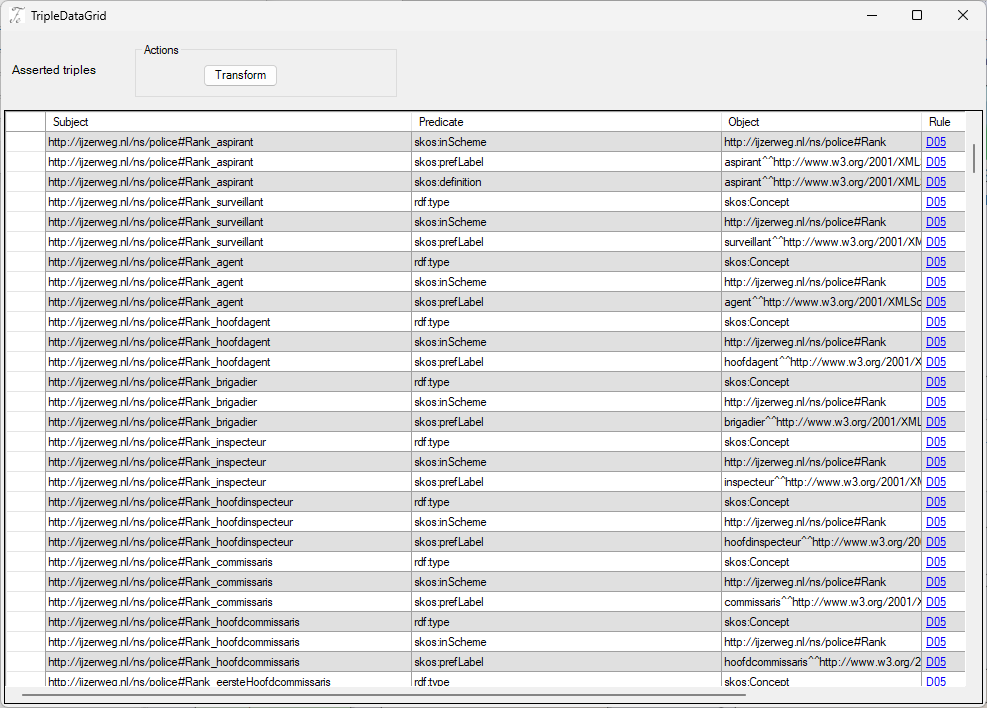
The triple grid
The triple grid lists the produced subject-predicate-object triples. A link to the applied SEMIC site lets the user check which transformation rule was applied. This feature adds trust to the transformation process and helps users understand how UML turns into triples.
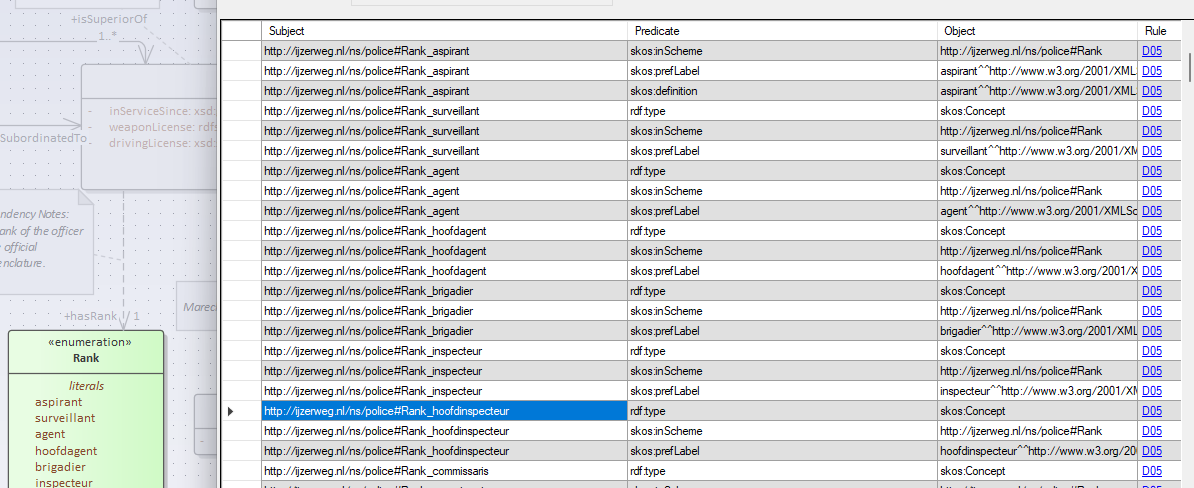
When you click a triple, the AddOn opens a diagram and highlights a UML element. The element in focus contains the information, i.e. attribute or relation, that governed the creation of the triple. Thus the user can easily check the match between triples and original model.
In below example, the user clicked the triple Rank_Hoofdinspecteur – rdf:type – skos:concept. The AddOn highlighted the “Rank”-enumeration that indeed displays the rank “Hoofdinspecteur”
The user can click on the link “D.05” which leads to the rule in the guide.
Turtle
Once happy with the produced triples, hit the transform button at the top of the triple grid. This produces a set of turtle files
core ontology which defines the concepts
restrictions which define triples used for OWL reasoning
shapes which define shacl shapes
merged ontology of all triples.
Please contact bob at ijzerweg dot nl if you’re interested in the Add-On for Sparx Enterprise Architect
The U in UML is short for Unified though the UML is mainly used for software engineering. Yet the UML has spread beyond software and is now commonly used to model technical systems and even more general knowledge about non-technical societal systems. As people stood back and reflected on the nature of modelling reality, be it in UML or any other method, they became aware that the ideas go back to Plato. This is reassuring because it basically says that our modelling practices are rooted in philosophy going back many centuries. How’s that that for proven technology?
Semantic engineers nor system architects consider themselves philosophers but it doesn’t hurt to be aware that the art of modelling reality has ancient roots. This also begs the question what needs to be done to rid a UML model of its “code smell”, i.e. which elements of the UML are allowed when one wishes to create a purely semantic “platonic model” of reality. This is actually a very useful exercise when modellers have a a software engineering perspective and tend to ask themselves how they would implement this or that in java, python, c#, sql, etc. They apply, (sub)conscious constraints to the model for fear of not being able to build a working product at a later stage. This is bad because it distracts from the exercise of capturing business knowledge and locks the model to technologies and products that evolve.
In modelling-speak, the model should never depend on a platform/technology/language or product. The ultimate pitfall is for a modeller to be tasked with having “to build a model for a database by SAP, Oracle, Microsoft, ….”. The result is likely to work and locked to the particular product. Imagine the cost of changing the platform. Things get even worse when time is short and the modeller builds quick fixes dictated by the product. Short term thinking and supplier lock-in are evil but tempting. Long term thinking is essential but can be a hard sell because it pays back later.
A simple approach to avoiding the pitfall of lock-in is to restrain oneself to a tiny subset of the UML class meta-model. Think classes, attributes, enumerations, generalisations and associations. These are the same toolset that Plato used so any thought of data bases is banished to a cave.
Classy knowledge modelling
UML class modelling is the work horse of object-oriented software engineering. People gather the essential business entities and their relations.
Clothes maketh the man
Clothes are to man what attributes are to a class. Think of a police officer and you see a person in a uniform, preferably dark blue. Typical attributes are a whistle, radio, a baton and fire arm. Other statements narrow down the definition in that a police officer is a kind of person who travels in a vehicle or on a bike, has a partner, and chases vilains.
UML modelleth the class
UML class modelling is the work horse of object-oriented software engineering. People gather the essential business entities and their relations. Early design commonly starts by eliciting the concepts and the attributes that make them what they are.
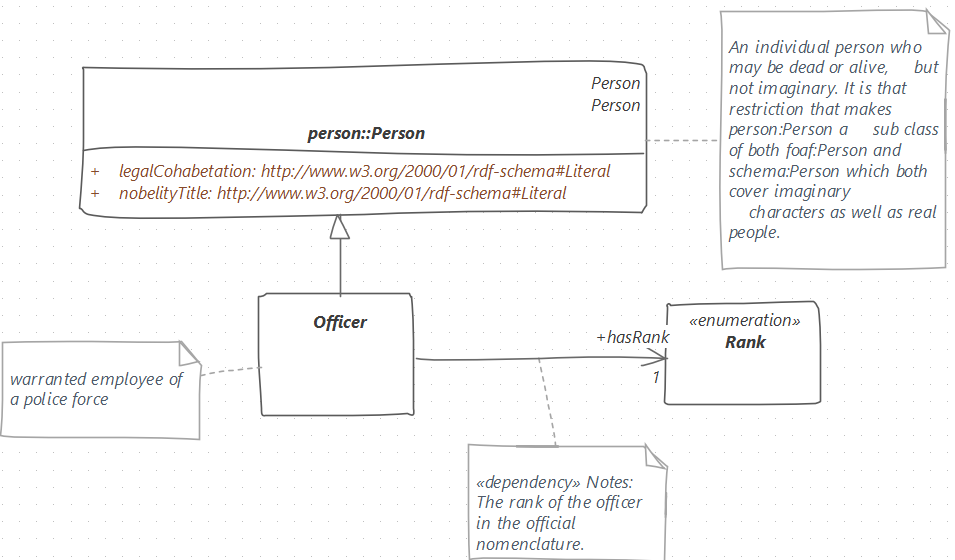
Models start living when experts draw a picture for laymen to lay bear the different concepts, attributes and relations. Below sketch shows how one would go about modelling a police officer in UML whilst reusing an existing class Person. The latter is imported from the Flemish “OSLO” model, definitions, including spelling mistakes and all. This would hook up our extension to an existing model so the meaning and context is perfectly clear.
Reusing existing models and the concepts defined therein is fundamental to interoperable information design.
Accepted UML elements
The sketch shows the subset of UML class models. The generalisation expresses that an Officer is a person and has a rank. The rank is provided as an association with stereotype <<dependency>>. The person inherits the legal cohabitation and nobility title from the OSLO model. The attributes data types are rdfs:Literal which implies that one can attach a language tag – @nl, @fr or @de in the Belgian context. Any other XSD data types are acceptable.
This said, the modeller should wonder whether these attributes are really what’s intended when modelling a police officer. It looks as if the OSLO model cares about information that would be found in a civil registry such as a knighthood. Alternatively, the modeller may want to check if foaf:Person or schema:Person meet her needs.
This tiny example really exposes the power of mixing in existing models with one’s own original work because it makes one ask questions that would go under the radar otherwise or reveals attributes that add spice to one’s model. Fancy being arrested by a knighted police officer.
A rose by any other name wouldn’t smell as sweet
Reusing existing models, like citations, helps people speak the same language and reduces semantic friction. Exchanging information is a lot easier when the data pertain to well defined concepts.
Call a rose a rose and use this definition of Rosa. The approach of using a neutral language, in this case latin, is the ancient equivalent of platform- and language-independence so, again, we’re not reinventing the wheel.
Reuse existing models and stand on the shoulders of giants
Publically available ontologies, i.e. libraries of object types including their definition and mutual relations, abound on the web. But how does one reuse this splendid corpus of work if you’re a humble software engineer who has to work with UML
or qualified as a well-known prefix plus a local name such as
foaf:Person
where foaf is short for the popular friend-of-a-friend ontology. Either way, a user can follow the link to the unequivocal meaning and the context in which foaf defines a person.
Import existing RDF
Sparx Enterprise Architect (EA) is a popular UML modelling tool. There’s adequate guidance for creating class models in EA. Importing an ontology as a package that can be integrated with our class models is a boon to developers. This page shows an Add-In that can fetch existing ontologies, either from the web or from a set of widely used ontologies such as foaf, skos, rdfs and many more.
Follow your nose
Ontologists tend to urge users to enter a model and read the specs as if it were a rabbit hole. An ontology being a graph, one discovers related terms, fascinating context and many more goodies. The side-effect of following one’s nose is that modellers and programmers alike will unwittingly information that can and should be (re-)used when building systems for a particular application.
Compare this to the present situation where a database developer has to build a model from a blank sheet and, when lucky, a heap of PDF documents and, even more luck, access to domain experts. Chances are that he won’t understand all of it, not being a domain expert, and make mistakes. Review and correction cycles will be needed that will drive nuts the modeller, domain expert and manager.
Building a model from existing ontologies, also known as knowledge graphs, makes life easier because the modeller can surf the graph and discover all there is to know. The prerequisite is of course that domain experts, past or present, locally grown or foreign ones, bothered to share their know-how in the shape of RDF knowledge-graphs.
The single source of truth
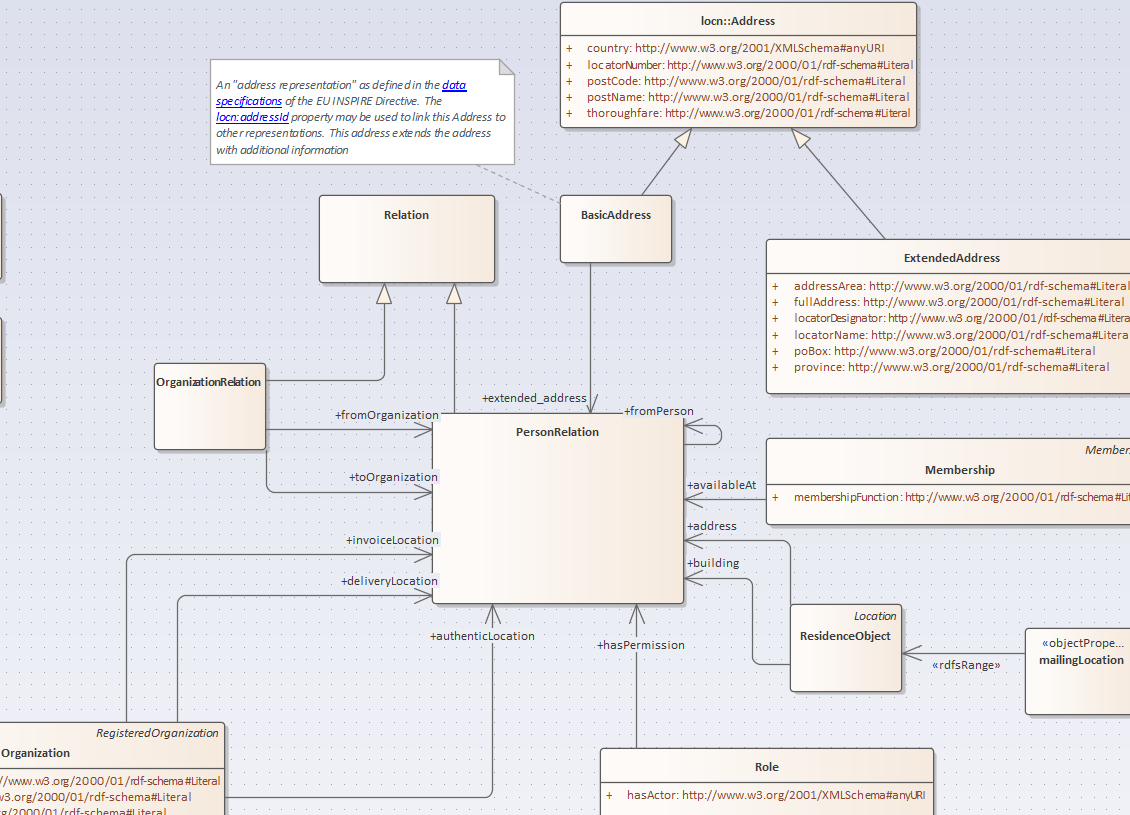
This example shows a set of classes in the “local government” namespace defined by OSLO. The text in the attached note is the definition stored with the BasicAddress. This hightlights the good modelling practice of keeping everything in one place. A developer doesn’t want to go looking for a definition of a class in a separate note.
A model with a view
The note in this diagram exposes the definition of the BasicAddress class. Notes can reveal to the reader the definition of classes, attributes or relations. The diagram focus is on on “Person Relation” which is of course central to local government business. There’s a lot more classes in this model than shown in this diagram so the diagram can be considered a human-friendly view of a particular concern. In this case a modeller would be interested in the relations and information that local government entertains with people under its administration.
Other views may be of something completely different, e.g. the planning permissions could focus on addresses and geographic outlines. Such focus diagrams would hide non-essential diagrams whilst showing classes such as geometry which is defined in the locn namespace. The curious modeller can easily poke around the model and design an algorith to find the the birth date of the owner of a parcel in a given community.
Dit verhaal is geïnspireerd door de reeks artikelen van Holger Knublauch over Shacl. Doel was het dichten van de mentale kloof tussen menselijk begrip welk vaak op beelden steunt, en triples, die minder sympathiek zijn voor de mens. Om te tonen hoe dit werkt, heb ik in een Visio diagram een schaakpartij getekend die alle informatie bevat over de afloop van een partij. Deze informatie is vervolgens als RDF/Turtle naar een triplestore overgebracht.
Een diagram is zodoende een drager van informatie voor de menselijke expert én eenvoudig te delen als Linked Data.
Het opsporen van de informatie welke een schaakpartij, of enig ander spel, definieert, blijkt eenvoudig te zijn indien we naar een tekening kijken en tegelijk de eigenschappen vastleggen van de dingen die we zien.
Al tekenend ontstaat het model.
Het grote voordeel van modelleren met een tekening is dat we het model parallel met de sjablonen vastleggen. De domeindeskundige, in dit geval een schaakspeler, en de modelleur schetsen samen hoe hun wereld eruit ziet.
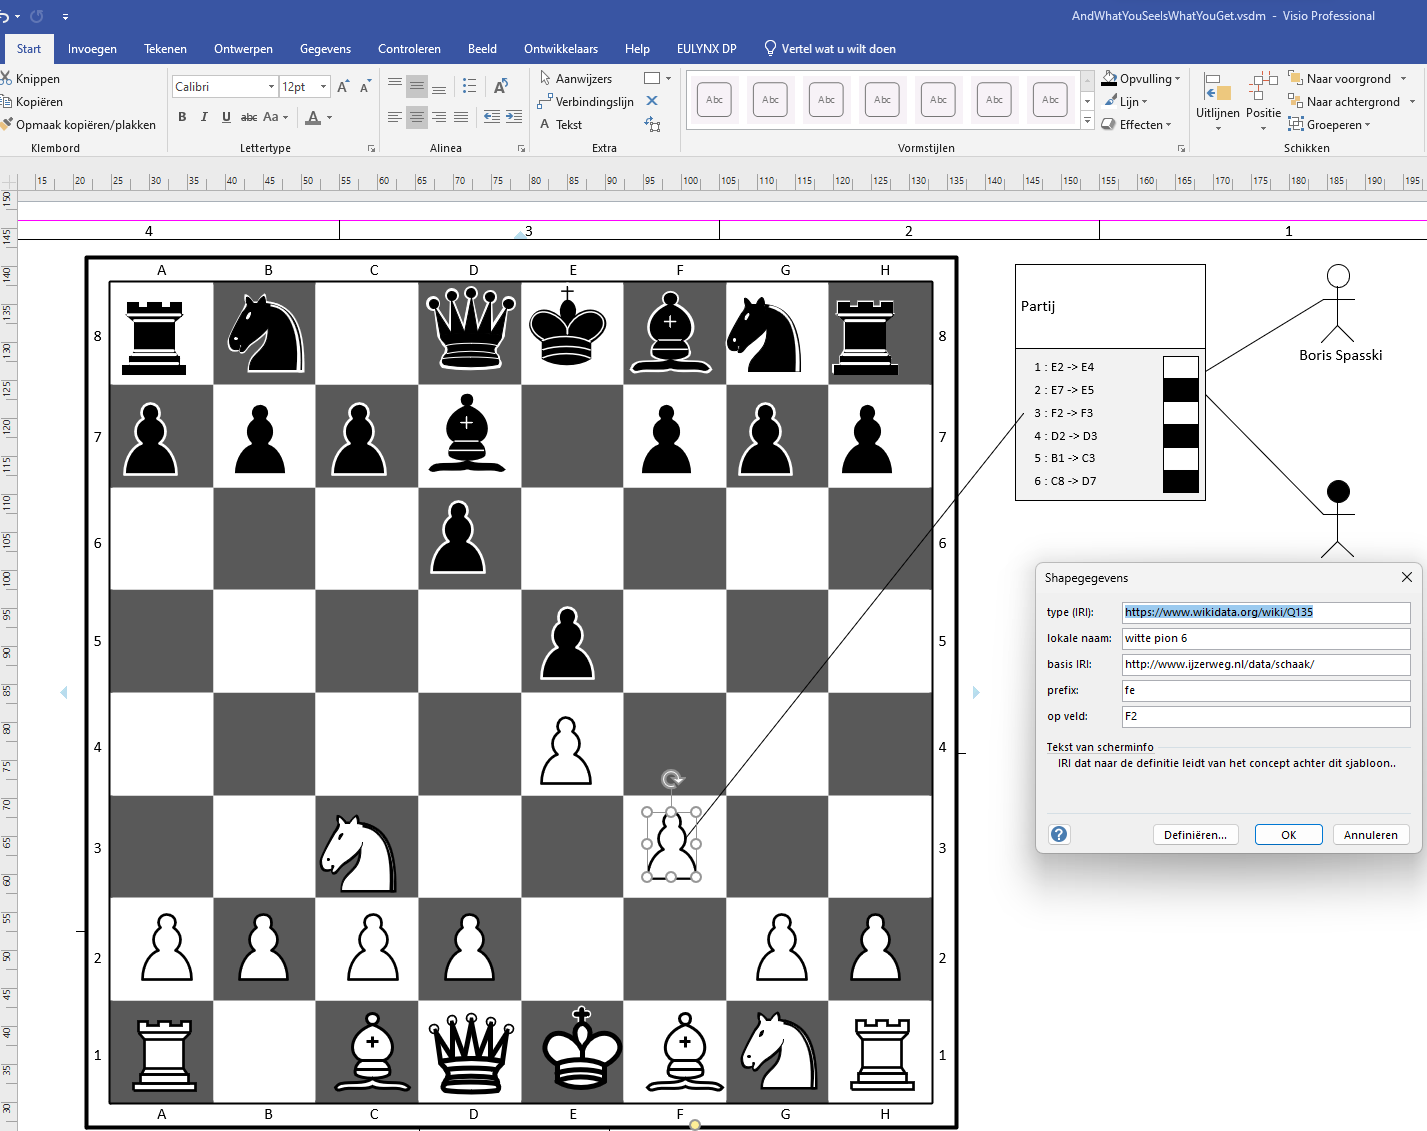
Schermafbeelding van een schaakstelling met meta-data opgetekend in Visio
De figuren in de tekening verhouden zich tot sjablonen als objecten tot klassen. Zo hebben de figuren eigenschappen die de sjabloon heeft. Het venster Shapegegevens toont de eigenschappen die de figuur van een witte pion heeft. Zo wijst `type (IRI)` naar de definitie van een schaakstuk op wikidata. De basis IRI plus lokale naam vormen samen een eenduidige naam waaruit een IRI van het schaakstuk gemaakt kan worden. De definities van de eigenschappen staan onder in het venster (“Tekst van scherminfo”). Informatie kan handmatig worden ingevoerd of automatisch worden bepaald. Zo kent Visio de positie van het stuk op het schaakbord en vult het de eigenschap “op veld F2” automatisch in.
Een soortgelijke modellering maken we van een speler. De eigenschappen zijn vrij gekozen en wellicht zijn er andere gegevens die al als LoD beschikbaar zijn zoals de ELO rating. Een ander, fictief, gegeven is de lichaamslengte van de speler die met een eenheid gepaard is. In dit geval is de eenheid millimeter maar meter of voet kan ook voorkomen. Een eigenschap met een meetbare waarde komt vaak voor in combinatie met eenheid of andere meta-gegevens zoals meetapparaat, standaardafwijking, omstandigheden van de meting, verwijzing naar een oorsprong, en zo voort. Deze meta-data geven inzicht in de kwaliteit van de meetwaarde. In Linked Data zien we typisch een meetwaarde terug als blanco node die als façade dient voor de achterliggende informatie – waarvan het getal `1804,00` slechts een klein deel vormt.
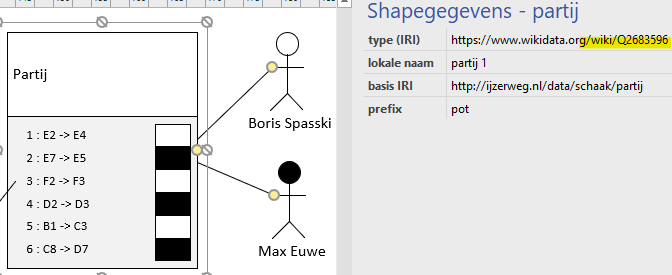
Eigenschappen van een schaakspeler
De eigenschappen in bovenstaand venster zijn meest literals, zo wordt de eigenschap titel gepaard met een letterlijke stringwaarde “grootmeester”. In de RDF data vindt men een subject-predicaat-object triple zoals <http//ijzerweg.nl/data/schaak/spelers/4712>, fe:titel, "grootmeester"@nl . .
Lijsten
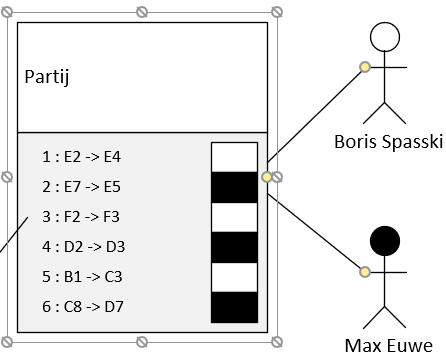
Een potje schaak is een opeenvolgende serie zetten door twee spelers. De volgorde van de zetten is natuurlijk van eerste belang. Onderstaand sjabloon toont dan ook een partij als een lijst genummerde zetten met afwisselend wit en zwart. De velden E2 –> E4 zijn handmatig ingetikt maar Visio kan met enige inspanning ertoe gebracht worden om de beweging van de stukken automatisch te registreren. De zetten in de partij geven weer van, en naar welk veld een stuk wordt verzet. In de tekening is een lijst een soort container waarvan de leden gerangschikt zijn.
Verwijzingen naar URI’s
De sjabloon “partij” verwijst naar twee spelers. In de tekening is deze verbinding gelegd door het gele schijfje, een “control”, van de partij-figuur naar de speler-figuur te trekken. Visio kleeft vervolgens de lijn aan het doelfiguur zodat de verbinding blijft bestaan ook indien we de spelers verplaatsen op het tekenblad.
Een schaakpartij is een lijst van opeenvolgende zetten door twee spelers. Hier speel Boris Spaski met wit en Max Euwe met zwart.
In de graaf zullen we een triple vinden welk dit concept voorstelt:
Iedere “control” in Visio heeft een naam. De controlverbinding tussen partij en spelers heet spelerWit c.q. spelerZwart en dit vinden we terug in het predicaat fe:spelerWit en fe:spelerZwart.
Foute en goede beslissingen, kwaliteitscontroles
Fouten zijn leerzaam en vast onderdeel van iteratieve modellering.
In bovenstaand model is de kleur waarmee de speler speelt een eigenschap van de speler. Visio kleurt de speler automatisch in aan de hand van de opgegeven kleureigenschap. Dit was een eerste intuïtieve maar onFAIRe keuze want het suggereert ten onrechte dat Boris Spasski slechts met wit kan uitkomen. De kleur waarmee een deelnemer speelt, moet dus een eigenschap van de partij zijn – niet van de speler.
Een tweede modelleerfout is het toekennen van een ELO-rating aan de speler. Op de eerste plaats is het goed mogelijk dat ergens op het web de ratings zijn opgeslagen maar ernstiger is het feit dat een rating geen constante eigenschap is. Een verbetering, hier niet uitgevoerd, is het koppelen van een rating aan een tijdvak.
Een object, in de zin van het laatste lid van een triple, kan ook een URI zijn dat verwijst naar een ander object. Zo verwijst een zet naar een stuk. In een tekening bovenaan in dit verhaal is zo’n verband inzichtelijk gemaakt door een verbindingslijn tussen de witte pion en de derde zet “F2-F3”.
Een goede beslissing was om de zet niet te koppelen aan een kleur van het gezette stuk. De kleur volgt namelijk uit het feit dat alle even zetten met zwart zijn én uit de kleur van het gezette stuk. Een mogelijke kwaliteitscontrole is hieruit te formuleren dat iedere even zet verbonden moet zijn met een zwart stuk.
Een zet hoeft strikt genomen niet verbonden te zijn met een stuk omdat de toestand van het schaakbord bij aanvang bekend is. Zo is af te leiden dat bij de eerste zet, E2->E4, een pion betrokken was. En bij de vijfde zet ging een stuk van B1 naar C3 – en dat moest wel het witte paard zijn geweest. De keuze om toch de relatie te leggen maakt het eenvoudiger om software rondom de data te schrijven want een programmeur wil waarschijnlijk niet de toestand van het spel vanaf het begin reconstrueren aan de hand van de gedane zetten.
De schaakklok ?
De tijd van de zet is van ondergeschikt belang in dit model maar het is voorstelbaar dat de duur tussen zetten interessante informatie geeft over tijdnood of complexiteit van de stelling. Uitbreiding van het model met tijdregistratie van zetten is natuurlijk mogelijk maar kan strijdigheden met de volgorde van de zetten opleveren die vervolgens tegen regels getest moeten worden. In dat geval moet men overwegen om de zetten niet als lijst maar als ongeordende verzameling (“Bag”) op te slaan. OWL biedt een geschikte ontologie om de tijd te modelleren.
Van tekening naar data
Bovenstaand verhaal maakt duidelijk hoe we de informatie in de tekening opslaan. Gelukkig heeft Visio, net als andere CAD of vectoriële tekenprogramma’s een API waarmee we aan de gegevens achter de getekende vormen komen. Het algoritme gaat als volgt
Maak een graaf aan
voor iedere figuur in de tekening welk een eigenschap `type (IRI)` heeft,
maak een subject aan van het type URI
beeld de eigenschappen van de shape af
de naam van de eigenschap wordt een predicaat
de waarde van de eigenschap word een literal van het type string of getal.
de waarde van een eigenschap die een eenheid heeft, wordt een blank node waarachter de getalswaarde als literal en de eenheid als URI worden afgebeeld
beeld een control af op een predicaat – object koppel
serialiseer de graaf naar turtle
upload de turtle naar een triple store
Van tekening naar data
Bovenstaand verhaal maakt duidelijk hoe we de informatie in de tekening opslaan. Gelukkig heeft Visio, net als andere CAD of vectoriële tekenprogramma’s een API waarmee we aan de gegevens achter de getekende vormen komen. Het algoritme gaat als volgt
Maak een graaf aan
voor iedere figuur in de tekening welk een eigenschap `type (IRI)` heeft …
maak een subject aan van het type URI
beeld de eigenschappen van de shape af
de naam van de eigenschap wordt een predicaat
de waarde van de eigenschap word een literal van het type string of getal.
de waarde van een eigenschap die een eenheid heeft, wordt een blank node waarachter de getalswaarde als literal en de eenheid als URI worden afgebeeld
beeld een control af op een predicaat – object koppel
serialiseer de graaf naar turtleupload de turtle naar een triple store
Schematic drawings can be considered front-ends to data. Each shape on the drawing carries information that can be captured as properties. Shapes have links to other shapes, e.g. a signal is located next to a track at a given distance along the track.
This article explores how Visio extracts the data from the schematic drawing. A Visio add-on produces structured data that are readily transformed into RDF (turtle format). This article, kindly hosted by Platform Linked Data Nederland, details how such data, can be explored and exploited.
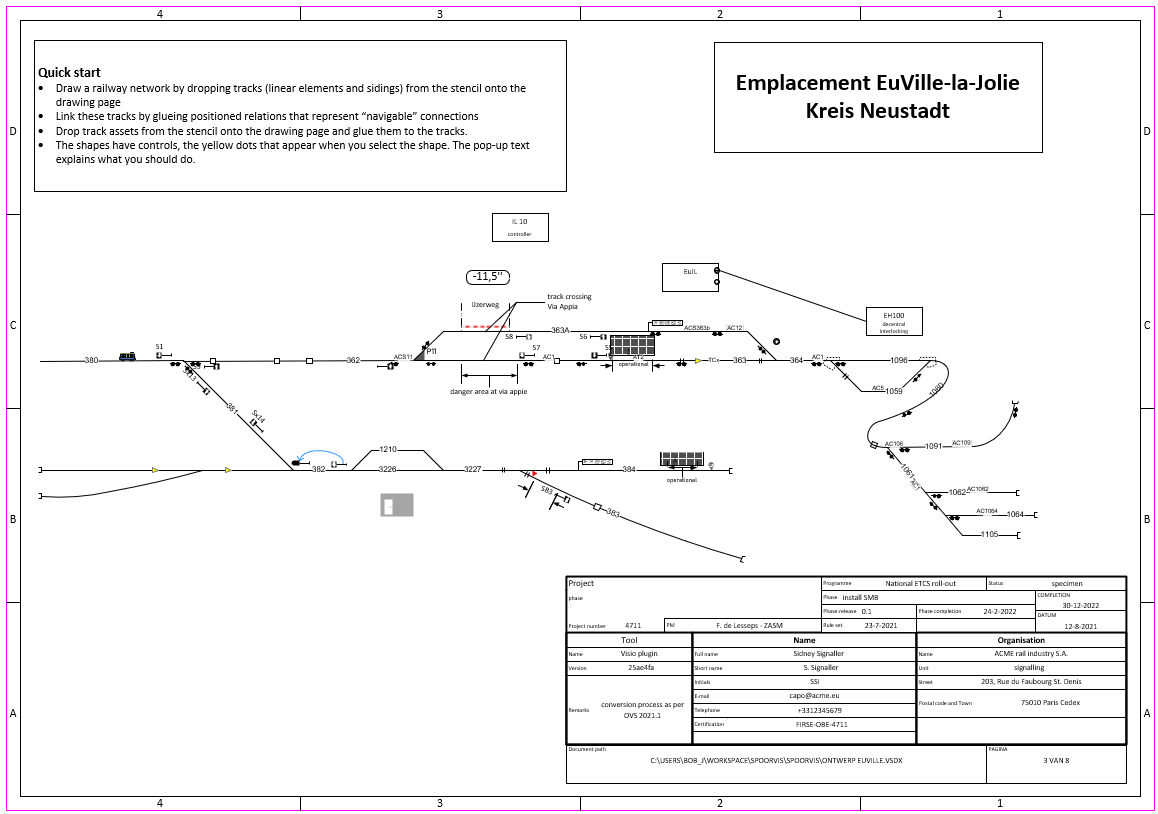
Schematic overview of a railway yard drawn and configured in Visio
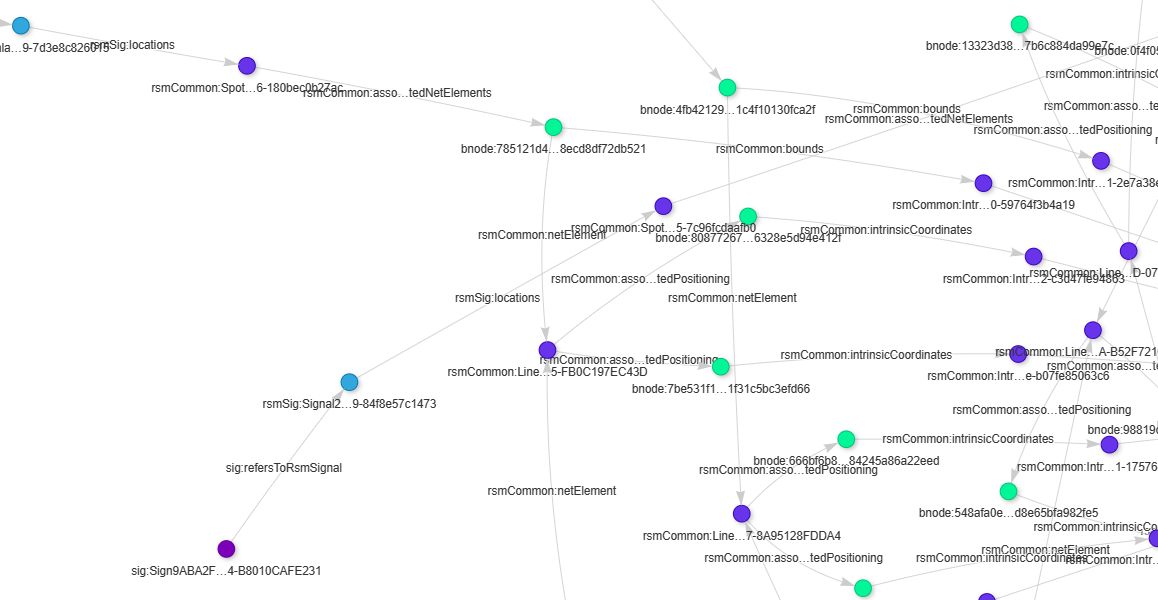
a few linked objects extracted from the drawing
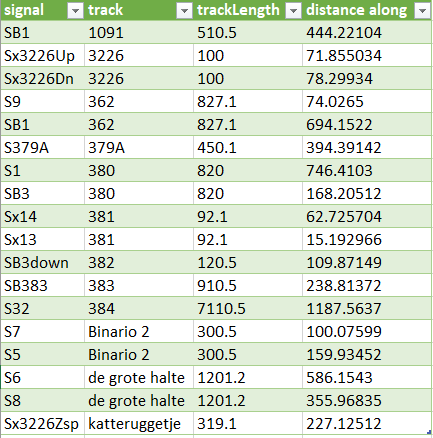
SPARQL queries can retrieve all sorts of interesting facts, such as the location of a signal along a track. Note that the table contains information that sits in the shape’s properties and aren’t necessarily visible in the drawing. A schematic drawing is for humans, the graph is what computers prefer, and an Excel table is for, well, old hands.
A common planning chore is to retrieve a list of objects encountered when travelling down a path through the network. This is a little more complex than finding a shortest path because of challenges such as
the downstream objects often have a “working direction” and may be only of interest if co-linear with the direction of traversal. One may wish to ignore signals that apply to opposite signals – a signal acts like a diode.
Commonly, people construct railway network graphs where points are nodes. Your average graph traversal algorithm would gladly jump from normal to reverse track. This is a fundamental difference between, say electric networks, and railway networks: trains don’t jump from normal to reverse tracks whereas electrons easily negotiate sharp corners.
Tracks can connect head-to-head, tail-to-tail or head-to-tail. Getting the traversal direction right when walking such a graph can be tricky.
The user may wish to scan only for a type of object, in this case signals. This implies that shapes must be “typed”.
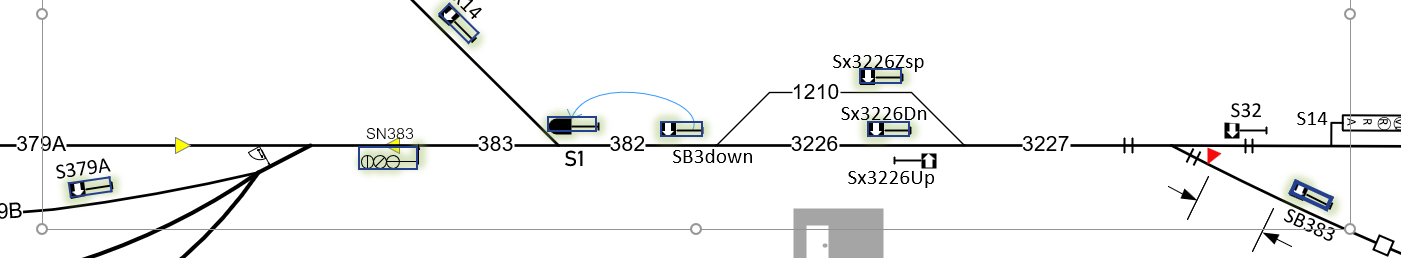
Below screenshot shows a part of the Euville-la-Jolie yard. Visio shapes can be enhanced with actions. Right-clicking the signal and selecting the action select exit signals will run an traversal algorithm that walks down the line as would a train, and select signals in the driving direction.
Note that the algorithm correctly negotiates points and ignores signals for opposite trains such as Sx3226Up or signals that can’t be reached such as S32.
The shapes that represent signals are a mix of DB, UK and French signalling schemes. The shapes are boosted with useful parameters. For instance the French signal shows the aspects that can be shown. This information, being present in the data, can also be captured and persisted in data. Each shape is an instance of a master and each master matches a type. This allows the scan algorithm to distinguish signals, balises, train detectors or whatever comes one’s way.
Selection of a set of co-linear signals is an important for creating route. A route follows a path from an entry signal to an exit signal. As this story suggests, one can build routes from the information in the drawing.
In a similar vein, one can construct ETCS movement authorities and profiles by scanning the information along the path that a train will travel.
Designers of networks, be it railway or telecoms, often face the question “how long is …” or “how far to…”. User stories abound, surely you can think of many more:
compute cable lengths for a best and final offer
distance between signals for optimal headway
braking distance to a danger point
time-to-target for time tabling
…
Getting the answer wrong has nasty consequences. Manual calculation, or even copy-pasting data into spreadsheets will have a high error rate. If the network topology and the length of curvi-linear shapes sits in the schematic drawing, why not let the drawing answer these questions.
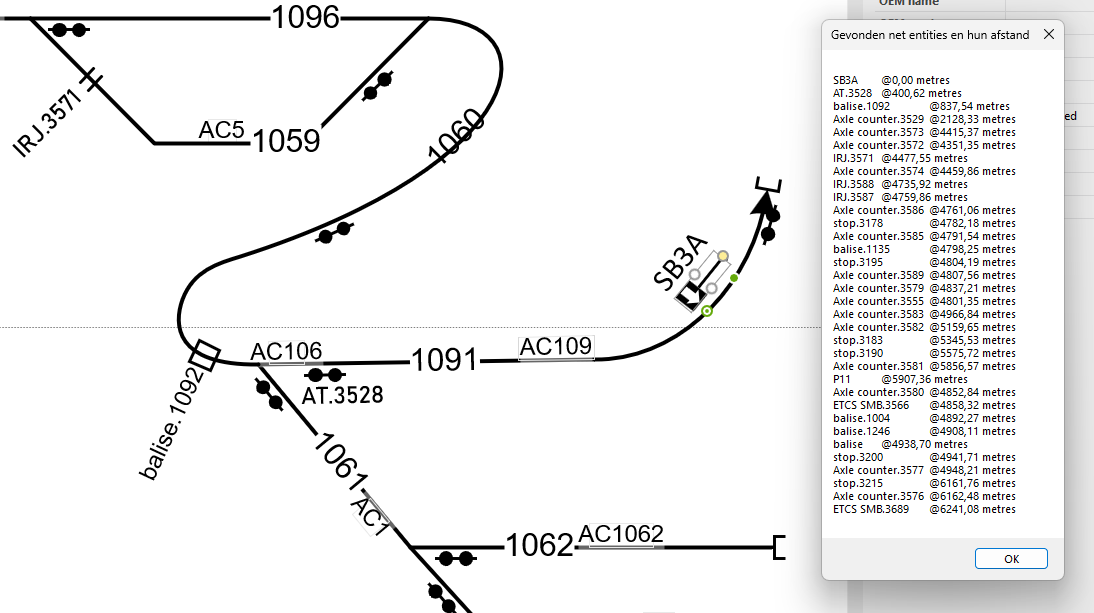
Right-click on signal SB3A and select “pick up kit downstream”. This traverses the paths across the network and picks up kit, including the distance along track. The pop-up to the right is a list of kit encountered en route.
How it’s done
The network topology is known so the software can traverse the network like a train would (or electrons/fluids/gas/IP-packets/…). The RSM graph that underlies the network includes “navigability” information which states that one can travel between tracks 1091-1060, tracks 1061-1060 but not between tracks 1091-1061 (because trains don’t jump).
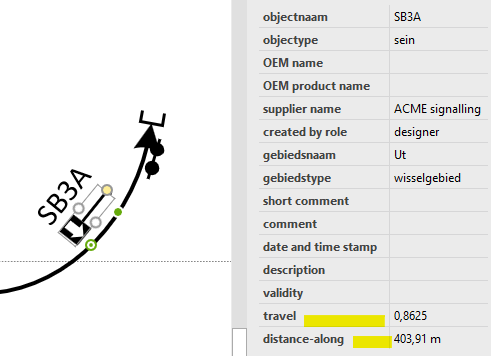
The tracks, or more general, the linear elements, have a nominal length property.
Finally, Visio “glued” the shape representing lineside kit to the tracks. A piece of equipment typically has a spot location that expresses where it is in terms of distance along a given track. Visio can compute this distance-along value, often called “travel” out of the box.
Summing it up, the distance from one piece of kit to the next is derived from network topology plus track length plus distance-along value.
Uncrowding
GIS programs plot things where they are on the surface of the earth. But things tend to crowd in places where there’s a lot of kit, e.g. in busy stations. A geographic plot of lineside equipment becomes illegible as symbols and labels overlap. Schematic drawings aren’t geographic maps and typically aren’t to scale. The skilled draughtsman pulls apart shapes to make the drawing visually pleasing but this distorts the travel value. This begs the question how one can compute distances along paths in such cases.
The solution is as simple as elegant. Instead of letting Visio compute the travel value, one can set the value or import it from a foreign data source as shown here.
CAD drawing is an art that few master. The threshold to drawing a design in Microsoft Visio is much lower. Check out how you can use Visio as a fully fledged CAD tool. Cheap and powerful.
A picture is worth a thousand words. Just imagine how many bytes are stuffed in below picture. The only question is how to retrieve the bytes from the drawing. Click here drawing data to find out.
In de 19e eeuw en tot diep in de 20e eeuw werd het woord ijzerweg gebruikt om spoorweg aan te duiden. Het is natuurlijk een letterlijke vertaling van chemin de fer en kwam daarom voornamelijk in het zuiden des lands voor.